Introduction
Analyzing congressional data reveals the underlying mechanics of the legislative process. Legislative text provides a massive, complex, and highly structured corpus perfect for representation learning, text classification, and NLP benchmarks. I scraped data from Congress.gov to analyze what actually happens to the thousands of bills introduced each session and to build a foundational dataset for downstream machine learning tasks.
This analysis focuses on the 117th Congress (2021-2023), examining 15,000+ bills to understand basic patterns: Which bills get introduced? How many receive votes? What factors influence success?
This post covers the foundational exploratory analysis and data collection process, setting the stage for predictive modeling and policy area classification.
Data Collection
My primary source is Congress.gov, maintained by the Library of Congress. I focused on the 117th Congress (2021-2023), collecting data on resolutions and joint resolutions while omitting amendments and concurrent resolutions.
Data collected:
| Bill Type | Introduced |
|---|---|
| House Resolution | 9,698 |
| House Joint Resolution | 106 |
| Senate Resolution | 5,357 |
| Senate Joint Resolution | 70 |
| Total | 15,231 |
Technical Implementation
Building a robust dataset for NLP requires careful handling of the source material. Congress.gov loads content dynamically and presents complex DOM structures, requiring a hybrid approach of static parsing and dynamic scraping to ensure high data quality.
Implementation details:
- Python for core orchestration and data schema management
- Selenium for executing JavaScript and loading dynamic page elements
- BeautifulSoup for structured HTML parsing
- Regex for text normalization and extracting clean legislative text for language models
I implemented a robust crawling strategy with 5-second delays between requests to respect server limits, resulting in a 3-day collection period. The pipeline handles edge cases in congressional text formatting and standardizes the output schema for immediate use in machine learning pipelines. The crawler and processed data are available on GitHub.
For each bill, I queried two pages:
- All info page:
https://www.congress.gov/bill/117th-congress/{bill_type}/{bill_id}/all-info - Text page:
https://www.congress.gov/bill/117th-congress/{bill_type}/{bill_id}/text?format=txt
The parsing process involved targeting specific HTML elements and implementing basic caching to avoid redundant requests.
Key Findings
The analysis reveals clear patterns in congressional activity. Most bills never receive votes, and success rates vary significantly by party and policy area.
Legislative Outcomes
The fundamental question: what happens to bills after introduction?
Each bill has a tracker status indicating its position in the legislative process. The eight possible statuses can be grouped into three meaningful categories:
- Introduced: Bills introduced but never voted on
- Stalled: Bills that saw votes but didn’t become law (since the 117th Congress ended, these effectively died)
- Law: Bills signed by the President
| Introduced | Stalled | Law | |
|---|---|---|---|
| House Resolution | 8,977 | 523 | 198 |
| House Joint Resolution | 102 | 1 | 3 |
| Senate Resolution | 5,083 | 114 | 160 |
| Senate Joint Resolution | 57 | 9 | 4 |
| Total | 14,219 | 647 | 365 |
Key insights:
- Only 7% of introduced bills ever receive a vote
- Of bills that receive votes, 36% become law
- Overall, just 2% of introduced bills become law
Sponsor Analysis
The bill sponsor (the primary member who introduces legislation) provides insights into party and geographic patterns.
Party Breakdown
| Introduced | Stalled | Law | |
|---|---|---|---|
| Democrat | 8,271 | 437 | 235 |
| Republican | 5,883 | 210 | 130 |
| Independent | 65 | 0 | 0 |
Party comparison:
- Democrats: 7.5% of bills moved beyond introduction; 2.6% became law
- Republicans: 5.5% of bills moved beyond introduction; 2.1% became law
- When bills do advance, Republicans have a slightly higher success rate (38% vs 35%)
Geographic Distribution
Top 10 states by bills introduced:
| Ranking | State: Introduced | State: Stalled | State: Law |
|---|---|---|---|
| 1 | CA: 1,350 | CA: 93 | CA: 34 |
| 2 | TX: 879 | NY: 44 | MI: 30 |
| 3 | NY: 784 | TX: 43 | TX: 25 |
| 4 | FL: 766 | MI: 28 | NY: 24 |
| 5 | IL: 660 | NJ: 28 | MN: 17 |
| 6 | PA: 521 | IL: 27 | IL: 16 |
| 7 | NJ: 478 | VA: 26 | OH: 11 |
| 8 | MI: 380 | FL: 24 | VA: 11 |
| 9 | OH: 377 | PA: 22 | FL: 11 |
| 10 | MA: 361 | OH: 19 | GA: 9 |
Per-representative normalization reveals different patterns:
| Ranking | State: Introduced | State: Stalled | State: Law |
|---|---|---|---|
| 1 | DC: 101.0 | DC: 7.0 | AK: 2.2 |
| 2 | NH: 47.5 | AK: 2.8 | NH: 2.0 |
| 3 | MT: 44.0 | IA: 2.3 | MT: 2.0 |
| 4 | OR: 41.0 | SD: 2.3 | MI: 1.9 |
| 5 | NV: 40.0 | NH: 2.2 | MN: 1.5 |
| 6 | DE: 38.7 | VA: 2.0 | HI: 1.5 |
| 7 | SD: 38.3 | NJ: 2.0 | CT: 1.3 |
| 8 | IA: 37.7 | PR: 2.0 | IA: 1.2 |
| 9 | RI: 36.5 | NV: 1.8 | OR: 1.1 |
| 10 | UT: 36.0 | MO: 1.8 | SD: 1.0 |
Top Individual Sponsors
Most prolific legislators by bills introduced:
| Ranking | Individual: Introduced | Individual: Stalled | Individual: Law |
|---|---|---|---|
| 1 | Sen. Rubio (R-FL): 186 | Sen. Peters (D-MI): 11 | Sen. Peters (D-MI): 19 |
| 2 | Sen. Klobuchar (D-MN): 143 | Sen. Cornyn (R-TX): 8 | Sen. Cornyn (R-TX): 15 |
| 3 | Sen. Lee (R-UT): 125 | Rep. Connolly (D-VA-11): 8 | Sen. Klobuchar (D-MN): 7 |
| 4 | Sen. Markey (D-MA): 118 | Rep. Takano (D-CA-41): 8 | Sen. Tester (D-MT): 6 |
| 5 | Sen. Casey (D-PA): 116 | Sen. Grassley (R-IA): 7 | Sen. Rubio (R-FL): 6 |
| 6 | Sen. Cortez Masto (D-NV): 109 | Del. Norton (D-DC): 7 | Rep. DeLauro (D-CT-3): 6 |
| 7 | Sen. Booker (D-NJ): 106 | Rep. Johnson (D-TX-30): 7 | Sen. Grassley (R-IA): 5 |
| 8 | Sen. Durbin (D-IL): 102 | Rep. Katko (R-NY-24): 7 | Sen. Ossoff (D-GA): 4 |
| 9 | Del. Norton (D-DC): 101 | Rep. Dean (D-PA-4): 6 | Sen. Murkowski (R-AK): 4 |
| 10 | Sen. Menendez (D-NJ): 99 | Rep. Wagner (R-MO-2): 6 | Sen. Padilla (D-CA): 4 |
Effectiveness score (laws enacted / total bills):
$$ \text{effectiveness} = \frac{\text{bills that became law}}{\text{total bills introduced}} $$
| Ranking | Individual: Effectiveness Score |
|---|---|
| 1 | Rep. Pelosi (D-CA-12): 0.500 |
| 2 | Rep. Mrvan (D-IN-1): 0.444 |
| 3 | Rep. Yarmuth (D-KY-3): 0.333 |
| 4 | Rep. Stivers (R-OH-15): 0.250 |
| 5 | Rep. Graves (R-MO-6): 0.222 |
| 6 | Rep. Jeffries (D-NY-8): 0.200 |
| 7 | Rep. Neal (D-MA-1): 0.200 |
| 8 | Rep. Palazzo (R-MS-4): 0.200 |
| 9 | Sen. Peters (D-MI): 0.186 |
| 10 | Rep. Fischbach (R-MN-7): 0.176 |
Policy Focus Areas
Each bill is assigned a primary policy area. Here are the most active areas by legislative outcome:
| Ranking | Policy Area: Introduced | Policy Area: Stalled | Policy Area: Law |
|---|---|---|---|
| 1 | Health: 1,885 | Government Operations: 79 | Government Operations: 94 |
| 2 | Armed Forces: 1,114 | Armed Forces: 60 | Armed Forces: 69 |
| 3 | Taxation: 1,066 | International Affairs: 60 | Crime & Law Enforcement: 31 |
| 4 | Government Operations: 982 | Health: 56 | Health: 19 |
| 5 | International Affairs: 866 | Crime & Law Enforcement: 44 | Native Americans: 17 |
| 6 | Crime & Law Enforcement: 842 | Public Lands: 44 | International Affairs: 14 |
| 7 | Education: 663 | Science & Technology: 44 | Economics & Finance: 13 |
| 8 | Transportation: 663 | Commerce: 43 | Public Lands: 13 |
| 9 | Public Lands: 548 | Finance: 34 | Commerce: 13 |
| 10 | Finance: 547 | Emergency Management: 27 | Emergency Management: 11 |
Notable patterns: Health dominates introductions but has lower success rates, while government operations and armed forces bills are more likely to become law.
Next Steps
This analysis establishes baseline patterns: most bills fail, party affiliation affects success rates, and certain policy areas perform better than others.
Future work could explore:
- Committee dynamics and voting patterns
- Geographic analysis of state-level interests
- Bill text analysis using NLP techniques
- Predictive modeling for bill outcomes
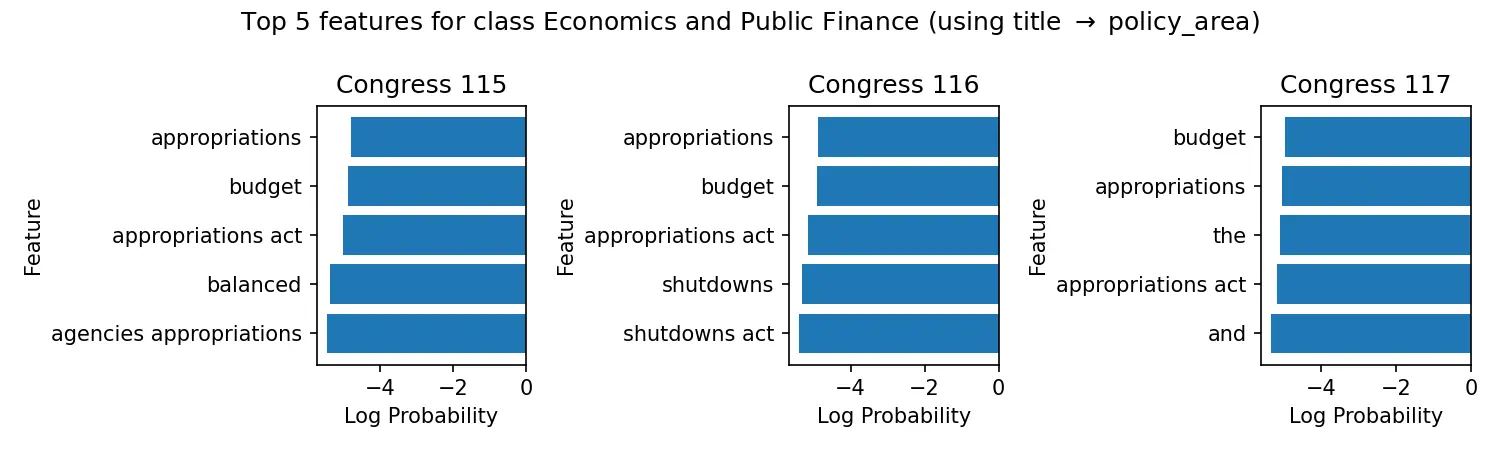
Update: I’ve since applied machine learning to this type of data in Congressional Bill Policy Area Classification, using 48K+ bills from three Congresses to automatically categorize bills by policy area.
The complete dataset and code are publicly available to support further research into legislative transparency.