Introduction
In Part One, we built a computational pipeline to generate Coulomb matrix eigenvalues for alkane constitutional isomers, replicating the approach from “Can One Hear the Shape of a Molecule (from its Coulomb Matrix Eigenvalues)?” Our analysis revealed concerning patterns that hinted at fundamental limitations:
- High correlation between eigenvalue dimensions
- Rapid dimensionality compression via PCA
- Overlapping distributions for larger molecules ($n \geq 6$)
These findings suggested eigenvalues might struggle to distinguish molecular shapes, but they didn’t definitively answer the question. Now we test eigenvalues directly: can they actually separate constitutional isomers without supervision?
Unsupervised learning provides the crucial test. If eigenvalues truly capture structural information, similar molecules should naturally cluster together. We’ll use rigorous clustering metrics to quantify separability. No training labels, no shortcuts.
The results will reveal whether mathematical elegance translates into practical discriminative power.
Data Loading
First, we reload the eigenvalue data generated in Part One:
import re
from glob import glob

spectra = {}
for n in range(1, 12):
    if n not in spectra:
        spectra[n] = {}

    for i, f in enumerate(glob(f'spectra/C{n}H{2*n + 2}_*.npy')):
        j = int(re.search(rf'C{n}H{2*n + 2}_(\d+).npy', f).group(1))
        spectra[n][j] = np.load(f)

    print(f'Loaded {len(spectra[n])}k spectra for C{n}H{2*n + 2}')
Testing Eigenvalue Separability
We’ll use two complementary clustering metrics to measure how well eigenvalues separate constitutional isomers. This is a fair test. We only compare isomers with identical molecular formulas, keeping eigenvalue dimensions constant.
Dunn Index: Global Cluster Quality
The Dunn Index provides a single metric capturing cluster quality. It asks: “Are the closest different clusters still farther apart than the most spread-out individual cluster?”
$$ \text{Dunn Index} = \frac{\text{smallest distance between different clusters}}{\text{largest diameter within any cluster}} $$
Higher values indicate better separation. When it approaches zero, clusters become indistinguishable, exactly what we suspected from the overlapping eigenvalue distributions in Part One.
Computing the Dunn Index for each alkane series:
import time

dunn_scores = {}
for n in range(4, 12):
    tik = time.time()
    dunn_scores[n] = dunn_index([spectra[n][i] for i in spectra[n]])
    tok = time.time()
    dunn_scores[n]['time'] = tok - tik
    print(f'C{n}H{2*n + 2}:', dunn_scores[n])
C4H10: {'diameter': 21.43072917950398, 'distance': 8.316362440688767, 'dunn_index': 0.3880578383978837, 'time': 0.06010293960571289}
C5H12: {'diameter': 23.449286379564892, 'distance': 2.4693042873545856, 'dunn_index': 0.10530402705587172, 'time': 0.10832405090332031}
C6H14: {'diameter': 19.602363375467938, 'distance': 1.4477574259511048, 'dunn_index': 0.07385626917634591, 'time': 0.28030991554260254}
C7H16: {'diameter': 20.065014927470955, 'distance': 0.4050094394280803, 'dunn_index': 0.02018485612355977, 'time': 1.0307331085205078}
C8H18: {'diameter': 24.794154667613665, 'distance': 0.5013450168168625, 'dunn_index': 0.020220290771668196, 'time': 4.199508905410767}
C9H20: {'diameter': 21.811025941686033, 'distance': 0.34381162248560415, 'dunn_index': 0.01576320267578513, 'time': 17.400264978408813}
C10H22: {'diameter': 27.180773716656066, 'distance': 0.4986608768730121, 'dunn_index': 0.0183460883811206, 'time': 86.00787401199341}
C11H24: {'diameter': 25.58731511020692, 'distance': 0.5490373275460223, 'dunn_index': 0.021457402825629343, 'time': 424.4431610107422}
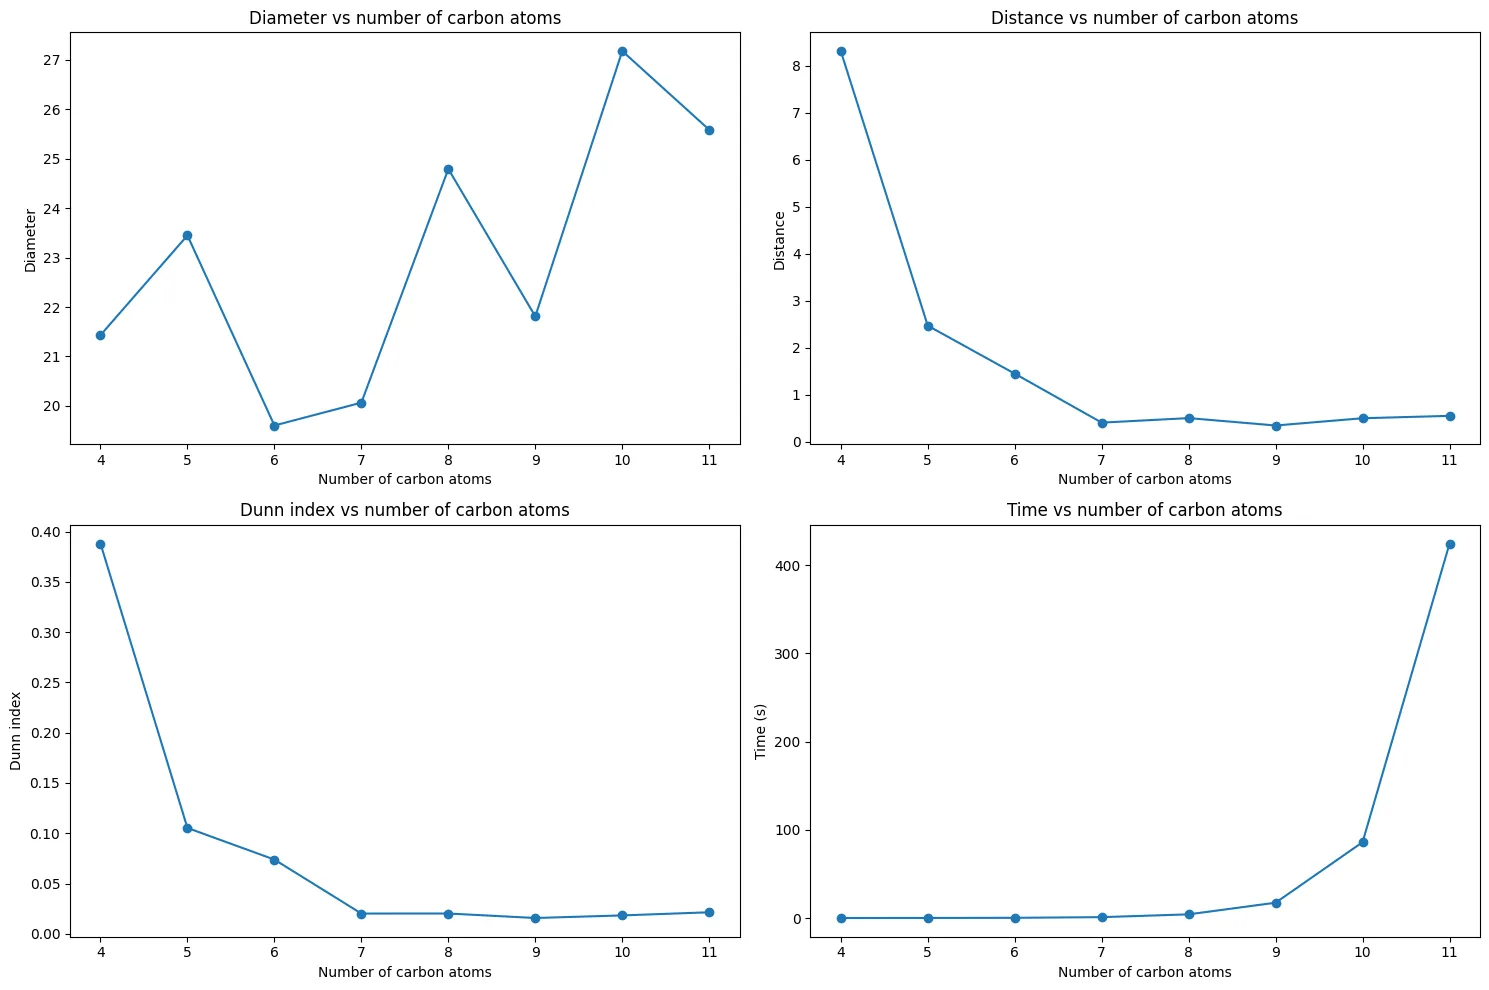
The computation time grows dramatically, over 7 minutes for $C_{11}H_{24}$, due to quadratic scaling with the number of isomers (159 isomers requiring ~12,000 pairwise comparisons).
The results reveal a clear trend:
fig, axs = plt.subplots(2, 2, figsize=(15, 10))

# in axs[0, 0] - diameter vs number of carbon atoms
axs[0, 0].plot(
    list(range(4, 12)),
    [dunn_scores[n]['diameter'] for n in range(4, 12)],
    marker='o'
)
axs[0, 0].set_xlabel('Number of carbon atoms')
axs[0, 0].set_ylabel('Diameter')
axs[0, 0].set_title('Diameter vs number of carbon atoms')

# in axs[0, 1] - distance vs number of carbon atoms
axs[0, 1].plot(
    list(range(4, 12)),
    [dunn_scores[n]['distance'] for n in range(4, 12)],
    marker='o'
)
axs[0, 1].set_xlabel('Number of carbon atoms')
axs[0, 1].set_ylabel('Distance')
axs[0, 1].set_title('Distance vs number of carbon atoms')

# in axs[1, 0] - dunn index vs number of carbon atoms
axs[1, 0].plot(
    list(range(4, 12)),
    [dunn_scores[n]['dunn_index'] for n in range(4, 12)],
    marker='o'
)
axs[1, 0].set_xlabel('Number of carbon atoms')
axs[1, 0].set_ylabel('Dunn index')
axs[1, 0].set_title('Dunn index vs number of carbon atoms')

# in axs[1, 1] - time vs number of carbon atoms
axs[1, 1].plot(
    list(range(4, 12)),
    [dunn_scores[n]['time'] for n in range(4, 12)],
    marker='o'
)
axs[1, 1].set_xlabel('Number of carbon atoms')
axs[1, 1].set_ylabel('Time (s)')
axs[1, 1].set_title('Time vs number of carbon atoms')

plt.tight_layout()
plt.savefig('dunn_index_vs_num_carbon_atoms.webp', bbox_inches='tight')

The trend confirms our concerns from Part One:
- $C_{4}H_{10}$: Excellent separation (Dunn Index = 0.39) between butane and isobutane
- $C_{5}H_{12}$ to $C_{6}H_{14}$: Rapid decline in separability
- $C_{7}H_{16}$ and beyond: Poor separation (Dunn Index ≈ 0.02)
This validates our computational pipeline and matches the original paper’s findings. For larger molecules, eigenvalue clusters become nearly indistinguishable, confirming the overlapping distributions we observed earlier.
Silhouette Analysis: Individual Conformation Assessment
The Dunn Index provides the global view, but what about individual molecules? The silhouette score evaluates each conformation separately, asking: “Is this molecule closer to its own isomer family or to a different one?”
For each molecular conformation $i$:
$$ s(i) = \frac{b(i) - a(i)}{\max(a(i), b(i))} $$
where:
- $a(i)$ = average distance to other conformations of the same isomer
- $b(i)$ = average distance to conformations of the nearest different isomer
Interpretation:
- Score near +1: Conformation clusters correctly (good clustering)
- Score near -1: Conformation closer to different isomer (misclassification)
This enables two critical measurements:
- How many isomers have any misclassified conformations?
- What fraction of individual conformations get misclassified?
from sklearn.metrics import silhouette_samples
from tqdm import tqdm

s_scores = {}
for n in tqdm(range(4, 12)):
    X = []
    y = []
    for i in spectra[n]:
        X.append(spectra[n][i])
        y.extend(np.full(spectra[n][i].shape[0], i))
    X = np.concatenate(X)
    y = np.array(y)

    s_scores[n] = silhouette_samples(X, y)
Computing both clustering quality metrics:
# Metric 1: Fraction of isomers with ANY negative scores
neg_iso = {}
for n in range(4, 12):
    n_iso = s_scores[n].shape[0] // 1000
    n_has_neg = 0
    for i in range(n_iso):
        chunk = s_scores[n][i * 1000:(i + 1) * 1000]
        if np.any(chunk < 0):
            n_has_neg += 1
    neg_iso[n] = n_has_neg / n_iso

# Metric 2: Individual conformation misclassification rates
neg_confs = {}
for n in range(4, 12):
    n_iso = s_scores[n].shape[0] // 1000
    neg_confs[n] = np.zeros(n_iso)
    for i in range(n_iso):
        isomer_scores = s_scores[n][i * 1000:(i + 1) * 1000]
        neg_confs[n][i] = np.sum(isomer_scores < 0) / isomer_scores.shape[0]
Isomer-Level Analysis

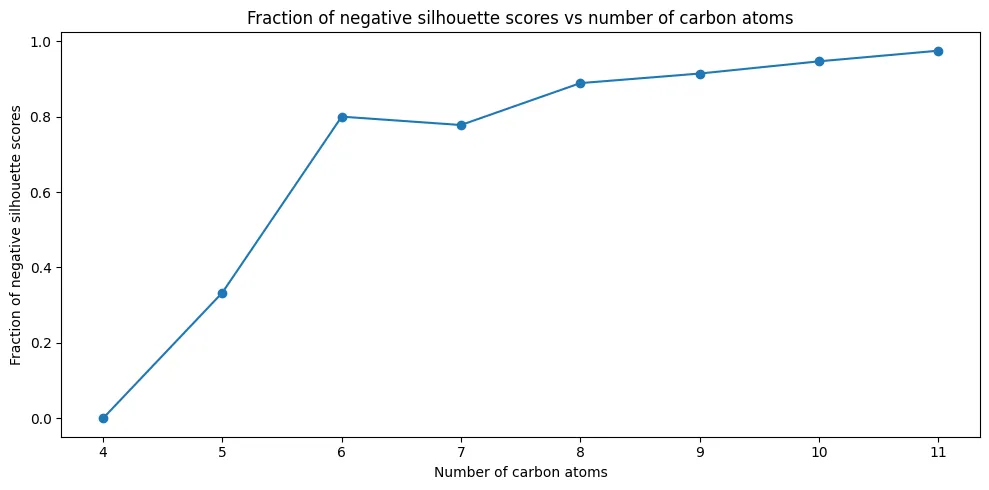
The trend is concerning: by $C_{11}H_{24}$, 97% of isomers have at least one conformation that would be misclassified. This metric is deliberately strict. Even a single misplaced conformation marks the entire isomer as problematic.
Conformation-Level Analysis

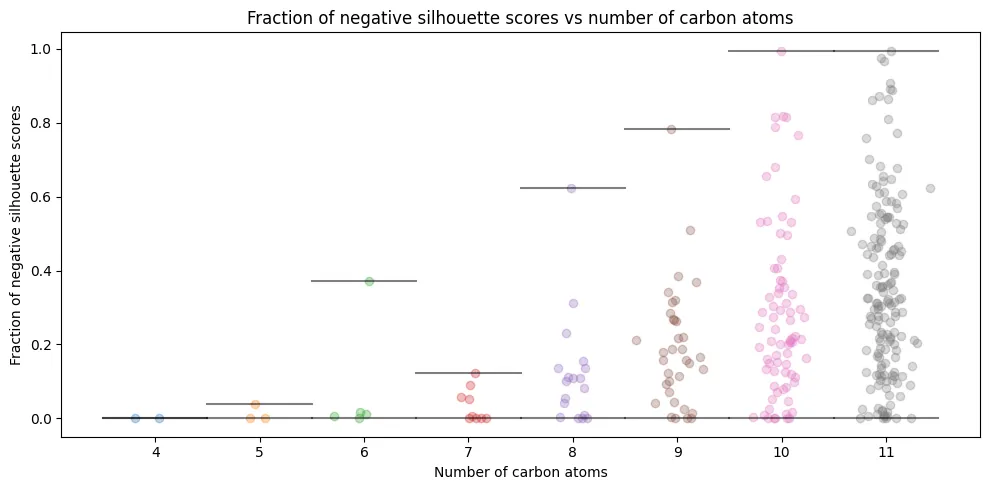
The individual analysis reveals dramatic variation:
- $C_{4}H_{10}$: Perfect clustering (0% misclassification), confirming our 2D separation plots from Part One
- $C_{5}H_{12}$ to $C_{6}H_{14}$: Modest problems (1-8% misclassification rates)
- $C_{11}H_{24}$: Average 35% conformations misclassified per isomer
Some isomers experience up to 99.5% conformation misclassification (they become essentially unrecognizable in eigenvalue space). This directly connects to our Part One observation: mathematical representations that appear elegant may lack the structural nuances needed for practical discrimination.
Key Findings
Both clustering metrics deliver the same conclusion: Coulomb matrix eigenvalues alone cannot reliably distinguish constitutional isomers for larger alkanes.
This isn’t an implementation failure; it’s a fundamental representation limitation. The mathematical elegance of eigenvalues hits a practical wall as molecular complexity increases.
Critical insights:
- Simple cases work beautifully: $C_{4}H_{10}$ achieves perfect separation, confirming our 2D visualization from Part One
- Rapid degradation: Separability deteriorates quickly as molecular size increases
- Practical threshold: By $C_{11}H_{24}$, unsupervised clustering becomes essentially meaningless
These results validate our computational pipeline and explain why the overlapping eigenvalue distributions from Part One translate into clustering failures. When mathematical signatures become too similar, algorithmic sophistication cannot compensate.
This raises a crucial question: if unsupervised methods fail without labels, what happens when we provide them? Can supervised learning extract hidden patterns that clustering algorithms miss?
We’ll explore this in Part Three, where we test whether machine learning models can learn the subtle structural differences that pure mathematical analysis cannot capture.
