Introduction
In Parts One and Two, we discovered a sobering truth about Coulomb matrix eigenvalues: while they work perfectly for simple molecules like butane, they struggle to distinguish constitutional isomers as molecular complexity increases.
Our unsupervised clustering analysis painted a clear picture: by $C_{11}H_{24}$, eigenvalue representations become nearly indistinguishable. But this raises a crucial question: what happens when we provide labels?
Can supervised learning extract hidden patterns that clustering couldn’t find? Perhaps the mathematical structure exists but requires guidance to discover. This is our final test of whether we can truly “hear the shape of a molecule” from eigenvalue signatures, inspired by the original work “Can One Hear the Shape of a Molecule (from its Coulomb Matrix Eigenvalues)?”
I’ll focus on two baseline approaches from the original paper: k-nearest neighbors and logistic regression. These represent fundamentally different learning paradigms (one memorizes patterns, the other learns linear boundaries) giving us insight into what types of structure might exist in eigenvalue space.
Experimental Setup
First, we reload our eigenvalue data, focusing only on molecules with constitutional isomers ($C_{4}H_{10}$ through $C_{11}H_{24}$):
import re
from glob import glob
import numpy as np

spectra = {}
for n in range(4, 12):
    if n not in spectra:
        spectra[n] = {}

    for i, f in enumerate(glob(f'spectra/C{n}H{2*n + 2}_*.npy')):
        j = int(re.search(rf'C{n}H{2*n + 2}_(\d+).npy', f).group(1))
        spectra[n][j] = np.load(f)

    print(f'Loaded {len(spectra[n])}k spectra for C{n}H{2*n + 2} with {spectra[n][0].shape[1]} dimensions')
This reveals our classification challenge scale:
Loaded 2k spectra for C4H10 with 14 dimensions
Loaded 3k spectra for C5H12 with 17 dimensions
Loaded 5k spectra for C6H14 with 20 dimensions
Loaded 9k spectra for C7H16 with 23 dimensions
Loaded 18k spectra for C8H18 with 26 dimensions
Loaded 35k spectra for C9H20 with 29 dimensions
Loaded 75k spectra for C10H22 with 32 dimensions
Loaded 159k spectra for C11H24 with 35 dimensions
Each molecular size represents a different classification problem: from 2 classes (butane) to 159 classes (undecane). Dimensionality grows with molecular size, but our PCA analysis from Part One showed most information concentrates in the first few eigenvalues.
Our helper function for preparing training data:
def prep_data(n: int):
    """Prepare data for classification."""
    X = []
    y = []
    for j, s in sorted(spectra[n].items(), key=lambda x: x[0]):
        n, _ = s.shape
        X.append(s)
        y.append(np.full(n, j))
    return np.concatenate(X), np.concatenate(y)
k-Nearest Neighbors: Pattern Recognition Through Memory
k-NN represents the simplest supervised learning approach: it stores all training examples and classifies new samples based on their closest neighbors. If eigenvalue patterns truly distinguish isomers, nearby points in eigenvalue space should belong to the same class.
This directly tests the local structure that unsupervised clustering couldn’t find. Perhaps global structure is poor, but local neighborhoods preserve meaningful distinctions.
Testing Different Feature Representations
We compare three approaches: full eigenvalue vectors, top 10 eigenvalues only, and PCA-reduced representations.
Testing 1-nearest neighbor with full dimensionality:
from sklearn.model_selection import cross_val_score, StratifiedKFold
from sklearn.neighbors import KNeighborsClassifier

df_1nn = []

for n in range(4, 12):

    # Prepare the data for CnH2n+2
    X, y = prep_data(n=n)

    # Create knn classifier
    knn = KNeighborsClassifier(n_neighbors=1)

    # Set up stratified 5-fold cross-validation
    cv = StratifiedKFold(n_splits=5)

    # Perform cross-validation. Since 'cross_val_score' computes accuracy, we compute misclassification rate by subtracting accuracy from 1.
    acc_scores = cross_val_score(knn, X, y, cv=cv, scoring='accuracy')

    # Convert accuracy scores to misclassification error rates
    misclassification_error_rates = 1 - acc_scores

    # Calculate the average and standard deviation of the misclassification error rates
    avg_misclassification_error = np.mean(misclassification_error_rates)
    std_misclassification_error = np.std(misclassification_error_rates)

    print(f'C{n}H{2*n + 2}: {avg_misclassification_error:.2%} ± {std_misclassification_error:.2%}')

    df_1nn.append({
        'molecule': f'C{n}H{2*n + 2}',
        'avg_misclassification_error': avg_misclassification_error,
        'std_misclassification_error': std_misclassification_error,
        'n': n,
        'representation': 'full',
        'model': '1nn',
    })
The results are remarkable compared to unsupervised clustering:
C4H10: 0.00% ± 0.00%
C5H12: 0.00% ± 0.00%
C6H14: 0.00% ± 0.00%
C7H16: 0.07% ± 0.05%
C8H18: 0.11% ± 0.05%
C9H20: 0.51% ± 0.09%
C10H22: 1.31% ± 0.09%
C11H24: 3.24% ± 0.09%
Perfect classification for molecules up to $C_{6}H_{14}$, with remarkably low error rates even for complex molecules like $C_{11}H_{24}$. This dramatically improves over clustering, where 97% of $C_{11}H_{24}$ isomers had misclassified conformations.
Note on feature scaling: Standardizing features significantly degraded performance; eigenvalue magnitudes carry crucial structural information.
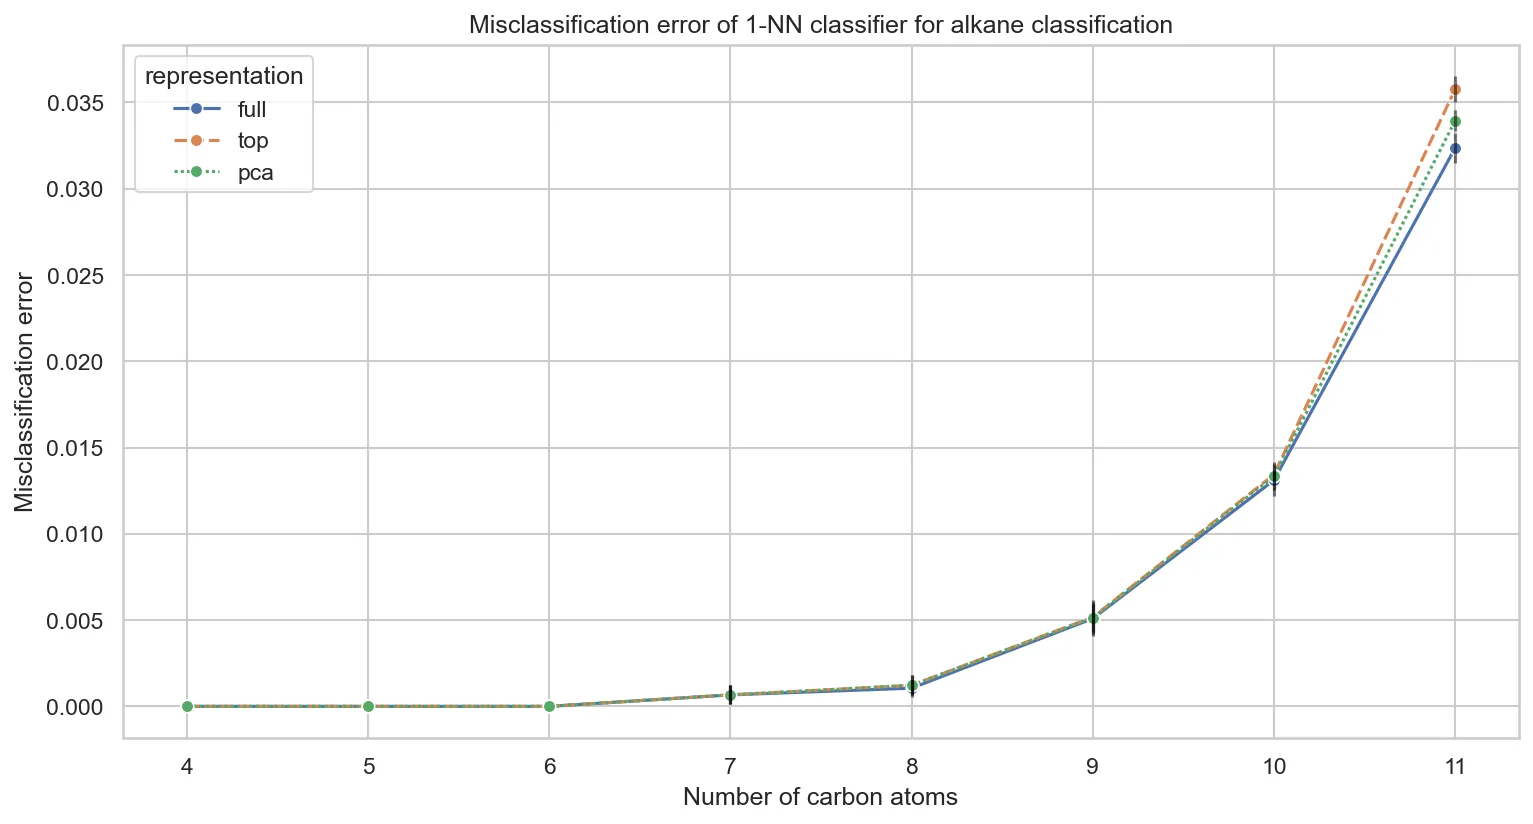
Comparing performance across different feature representations:

Key insights:
- Representation choice matters little for 1-NN-full, top-10, and PCA perform nearly identically
- PCA slightly outperforms top-10 eigenvalues for larger molecules, capturing more structural variance
- Perfect classification persists through $C_{6}H_{14}$ regardless of representation
This confirms that discriminative information concentrates in the largest eigenvalues, validating our PCA findings from Part One.
The Neighbor Count Effect
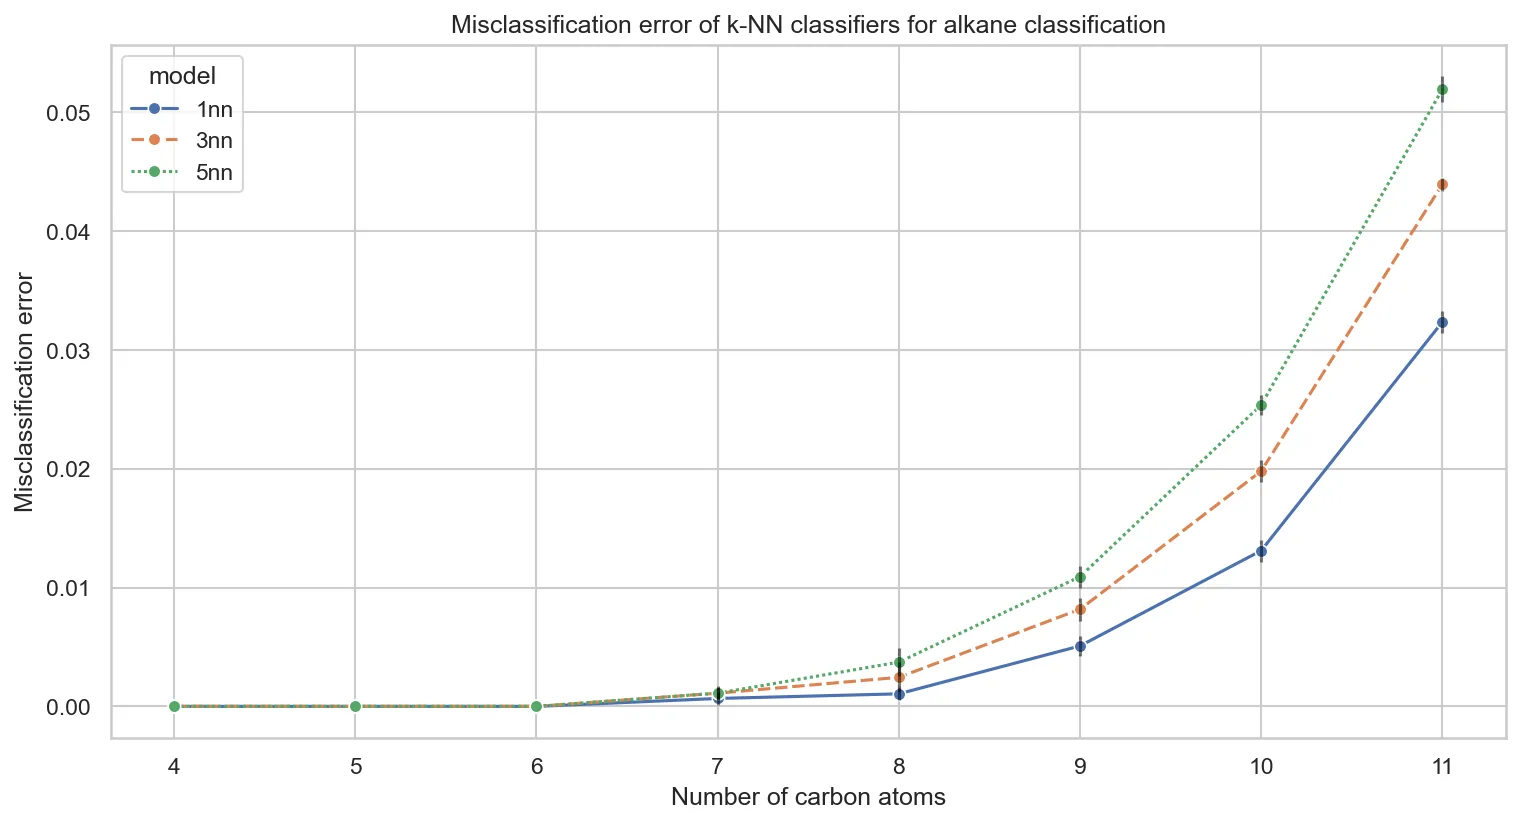
Testing k-NN with different neighbor counts (k=1, 3, 5) reveals a counterintuitive pattern:

Why does performance degrade with more neighbors? This connects directly to our clustering analysis from Part Two. The eigenvalue space lacks meaningful local structure. When k-NN examines beyond the immediate nearest neighbor, it increasingly finds examples from different classes.
This validates our unsupervised findings: without clear cluster boundaries, examining more neighbors introduces noise rather than signal.
Logistic Regression: Learning Linear Decision Boundaries
Logistic regression represents a fundamentally different approach. Instead of memorizing examples, it learns linear decision boundaries in eigenvalue space. If eigenvalues encode structural information linearly, this should work well.
We’ll focus on PCA-reduced representations to keep computation manageable, using insights from the k-NN analysis.
from sklearn.linear_model import LogisticRegression
from sklearn.pipeline import Pipeline
from sklearn.decomposition import PCA

df_lr = []

for n in range(4, 12):
    # Prepare the data for CnH2n+2
    X, y = prep_data(n=n)

    # Create logistic regression classifier with PCA
    lr = Pipeline([
        ('pca', PCA(n_components=10)),
        ('lr', LogisticRegression(
            max_iter=10_000,
            penalty='l2',
            solver='lbfgs',
            C=10.0,  # Reduced regularization
            random_state=42,
            n_jobs=-1,
        ))
    ])

    # 5-fold stratified cross-validation
    cv = StratifiedKFold(n_splits=5)
    acc_scores = cross_val_score(lr, X, y, cv=cv, scoring='accuracy')

    # Convert to misclassification rates
    avg_error = np.mean(1 - acc_scores)
    std_error = np.std(1 - acc_scores)

    print(f'C{n}H{2*n + 2}: {avg_error:.2%} ± {std_error:.2%}')
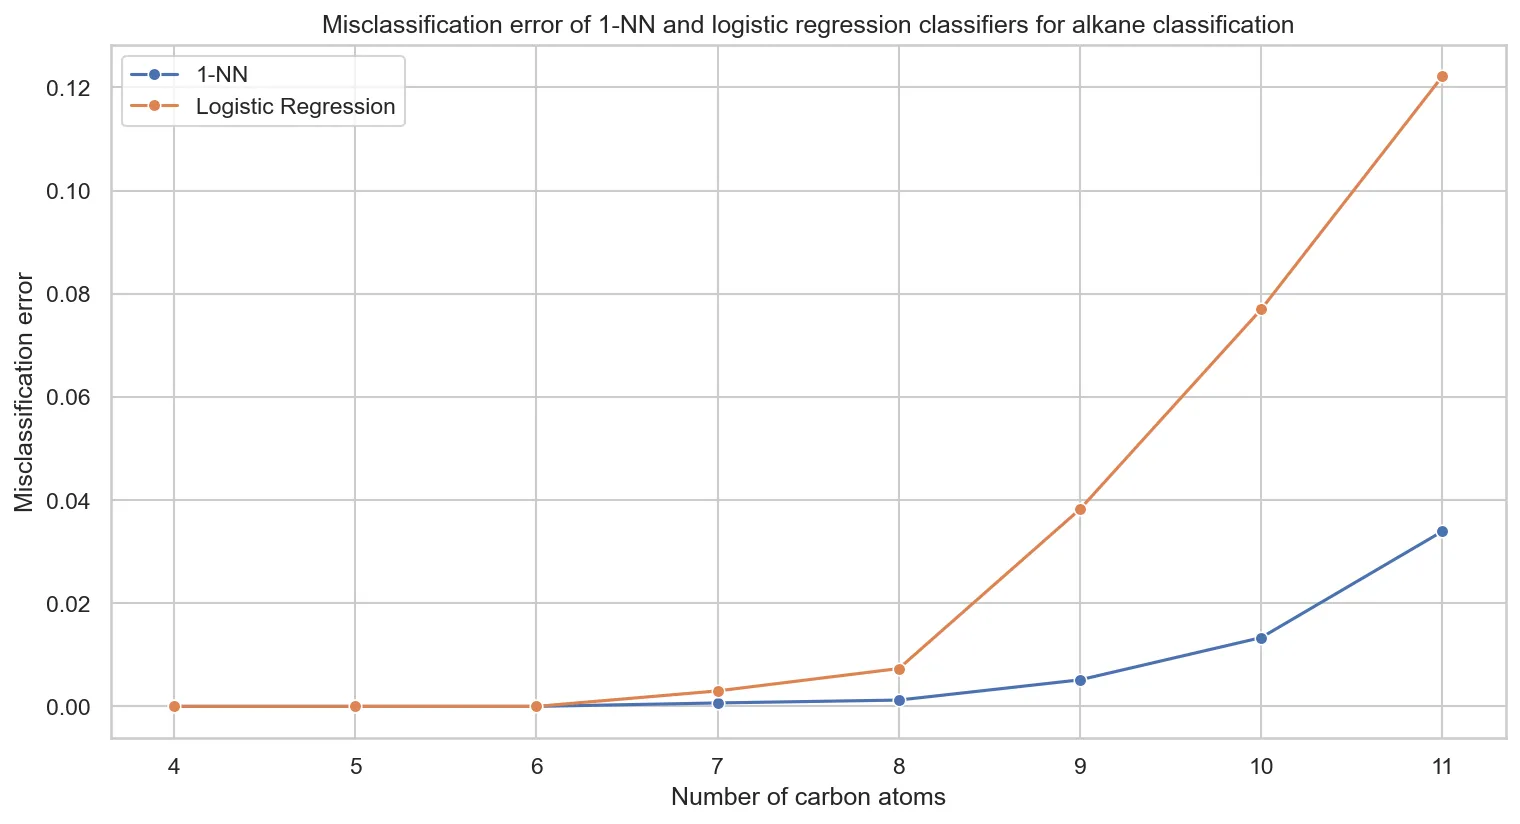
Comparing k-NN versus logistic regression performance:

Key observations:
- k-NN dominates across all molecular sizes
- Linear boundaries fail for larger molecules. This suggests nonlinear eigenvalue relationships.
- Performance gap grows with molecular complexity, indicating increasingly nonlinear structural patterns
The poor logistic regression performance suggests that discriminative patterns in eigenvalue space are fundamentally nonlinear. Linear models cannot capture the complex relationships needed to distinguish constitutional isomers.
Key Findings
Our supervised learning experiments reveal a nuanced picture of Coulomb matrix eigenvalues as molecular descriptors:
What works:
- k-NN achieves remarkable performance: even 97% accuracy for $C_{11}H_{24}$ with 159 classes
- Local structure exists where global clustering failed
- Eigenvalue magnitudes matter: scaling destroys performance
- Dimensionality reduction works: top eigenvalues capture discriminative information
What struggles:
- Linear models fail for complex molecules
- Performance degrades with molecular size, even for k-NN
- Nonlinear patterns dominate: requiring memory-based rather than parametric approaches
The crucial insight: Labels unlock hidden structure that unsupervised methods missed. While eigenvalues cannot form clean global clusters, they preserve enough local structure for nearest-neighbor classification to work remarkably well.
Implications for Molecular Representation
This three-part series reveals important lessons about molecular representations:
- Mathematical elegance ≠ practical utility: Eigenvalues are mathematically beautiful but have fundamental limitations
- Context matters: The same representation can fail unsupervised but succeed supervised
- Molecular complexity is challenging: Even simple alkanes test our best descriptors
- Local vs. global structure: Sometimes neighborhoods matter more than the big picture
For practitioners working with molecular representations:
- Test multiple learning paradigms: supervised and unsupervised often give different insights
- Consider nonlinear relationships in molecular feature spaces
- Always validate on simple test cases first
- Be skeptical of elegant mathematical solutions to complex chemical problems
Looking forward: Modern approaches like graph neural networks and transformer-based molecular representations have largely superseded eigenvalue methods. But understanding why simpler approaches fail helps us appreciate what makes newer methods successful.
