Paper Information
Citation: Yoo, S., Kwon, O., & Lee, H. (2022). Image-to-Graph Transformers for Chemical Structure Recognition. arXiv preprint arXiv:2202.09580. https://doi.org/10.48550/arXiv.2202.09580
Publication: arXiv 2022
Contribution and Taxonomic Classification
This is a Method paper. It proposes a novel deep learning architecture designed to extract molecular structures from images by directly predicting the graph topology. The paper validates this approach through ablation studies (comparing ResNet-only baselines to the Transformer-augmented model) and extensive benchmarking against existing tools.
The Challenge with SMILES and Non-Atomic Symbols
- Handling Abbreviations: Chemical structures in scientific literature often use non-atomic symbols (superatoms like “R” or “Ph”) to reduce complexity. Standard tools that generate SMILES strings fail here because SMILES syntax does not support arbitrary non-atomic symbols.
- Robustness to Style: Existing rule-based tools are brittle to the diverse drawing styles found in literature.
- Data Utilization: Pixel-wise graph recognition tools (like ChemGrapher) require expensive pixel-level labeling. An end-to-end approach can utilize massive amounts of image-molecule pairs (like USPTO data) without needing exact coordinate labels.
The Image-to-Graph (I2G) Architecture
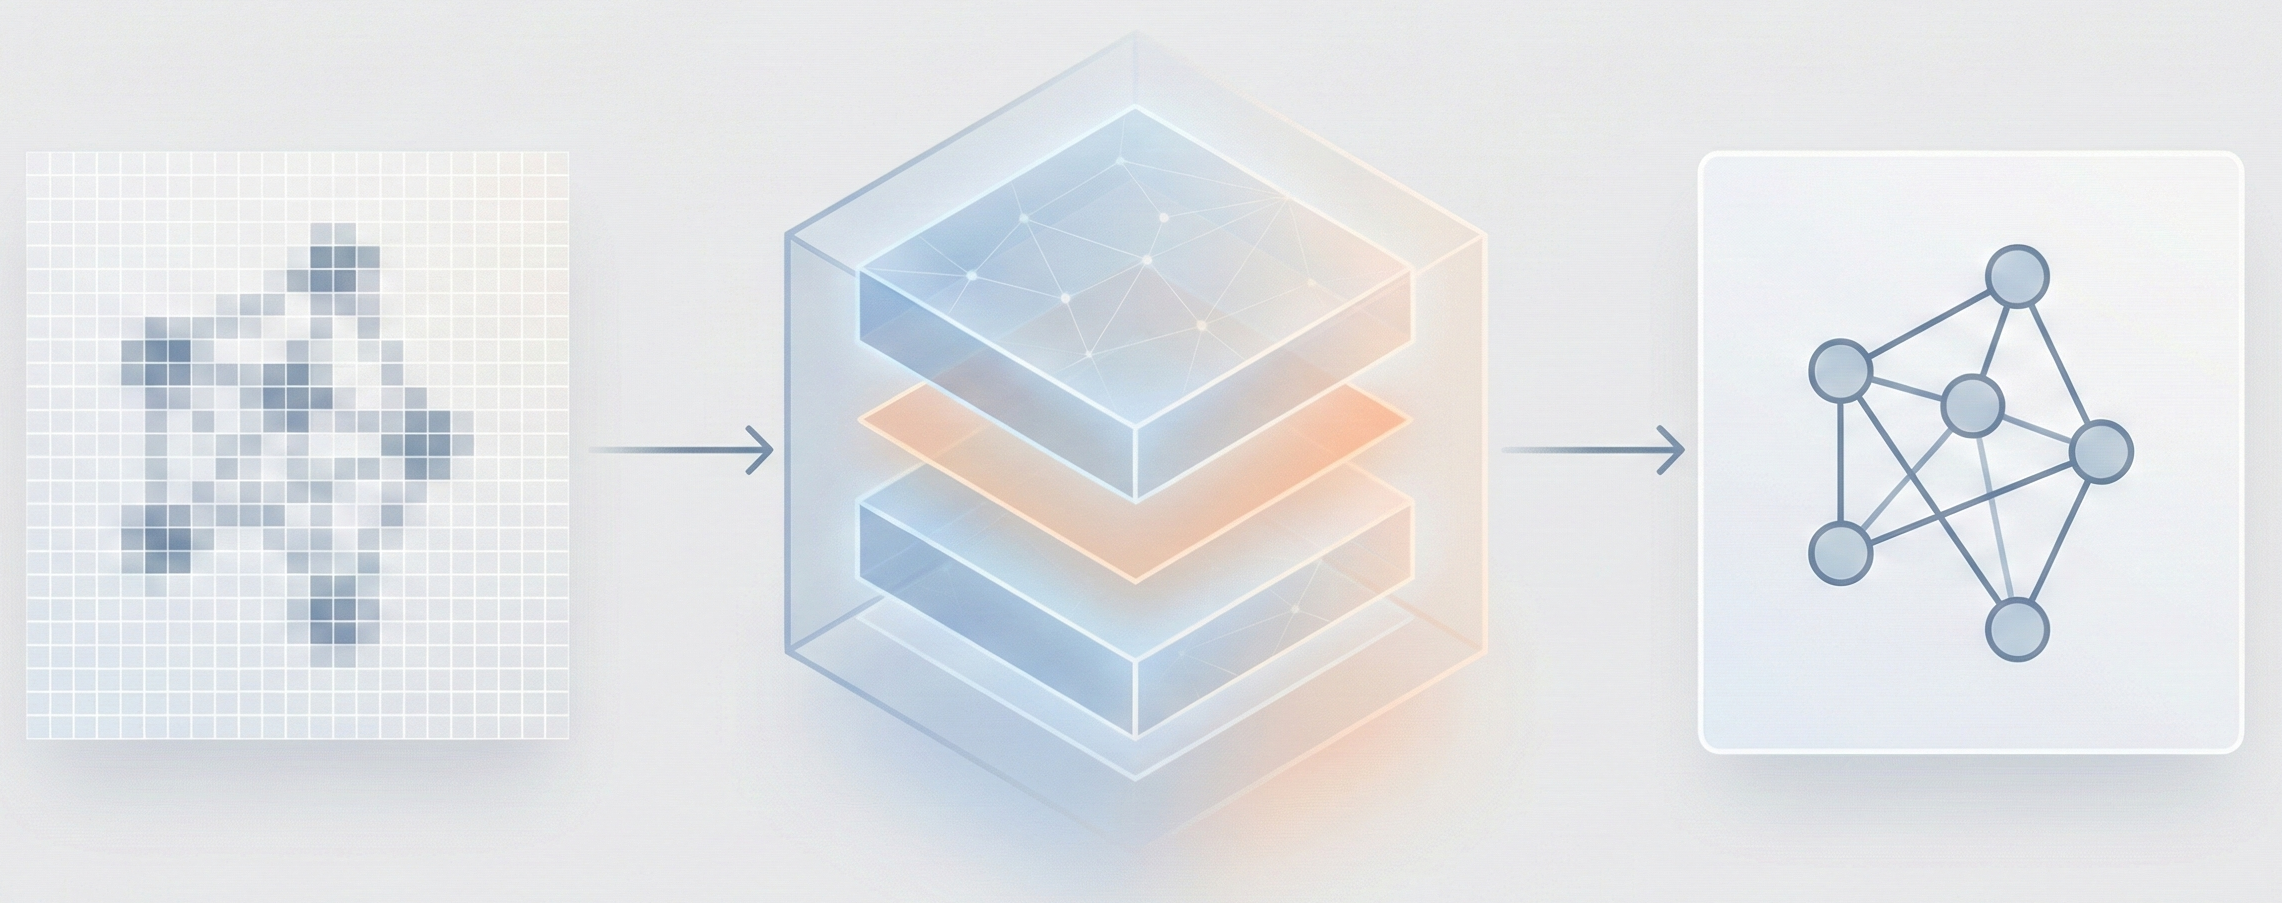
The core novelty is the Image-to-Graph (I2G) architecture that bypasses string representations entirely:
- Hybrid Encoder: Combines a ResNet backbone (for locality) with a Transformer encoder (for global context), allowing the model to capture relationships between atoms that are far apart in the image.
- Graph Decoder (GRAT): A modified Transformer decoder that generates the graph auto-regressively. It uses feature-wise transformations to modulate attention weights based on edge information (bond types).
- Coordinate-Aware Training: The model is forced to predict the exact 2D coordinates of atoms in the source image. Combined with auxiliary losses, this boosts SMI accuracy from 0.009 to 0.567 on the UoB ablation (Table 1 in the paper).
Experimental Setup and Baselines
- Baselines: The model was compared against OSRA (rule-based), MolVec (rule-based), and ChemGrapher (deep learning pixel-wise).
- Benchmarks: Evaluated on four standard datasets: UoB, USPTO, CLEF, and JPO. Images were converted to PDF and back to simulate degradation.
- Large Molecule Test: A custom dataset (OLED) was created from 12 journal papers (434 images) to test performance on larger, more complex structures (average 52.8 atoms).
- Ablations: The authors tested the impact of the Transformer encoder, auxiliary losses, and coordinate prediction.
Empirical Results and Robustness
- Benchmark Performance: The proposed model outperformed existing models with a 17.1% relative improvement on benchmark datasets.
- Robustness: On large molecules (OLED dataset), it achieved a 12.8% relative improvement over MolVec (and 20.0% over OSRA).
- Data Scaling: Adding real-world USPTO data to the synthetic training set improved performance by 20.5%, demonstrating the model’s ability to learn from noisy, unlabeled coordinates.
- Handling Superatoms: The model successfully recognized pseudo-atoms (e.g., $R_1$, $R_2$, $R_3$) as distinct nodes. OSRA, which outputs SMILES, collapsed them into generic “Any” atoms since SMILES does not support non-atomic symbols. MolVec could not recognize them properly at all.
Limitations and Error Analysis
The paper identifies two main failure modes on the USPTO, CLEF, and JPO benchmarks:
- Unrecognized superatoms: The model struggles with complex multi-character superatoms not seen during training (e.g., NHNHCOCH$_3$ or H$_3$CO$_2$S). The authors propose character-level atom decoding as a future solution.
- Caption interference: The model sometimes misidentifies image captions as atoms, particularly on the JPO dataset. Data augmentation with arbitrary caption text or a dedicated image segmentation step could mitigate this.
Reproducibility Details
Data
The authors used a combination of synthetic and real-world data for training.
| Purpose | Dataset | Size | Notes |
|---|---|---|---|
| Training | PubChem | 4.6M | Synthetic images generated using RDKit. Random superatoms (e.g., $CF_3$, $NO_2$) were substituted to simulate abbreviations. |
| Training | USPTO | 2.5M | Real image-molecule pairs from patents. Used for robustness; lacks coordinate labels. |
| Evaluation | Benchmarks | ~5.7k | UoB, USPTO, CLEF, JPO. Average ~15.8 atoms per molecule. |
| Evaluation | OLED | 434 | Manually segmented from 12 journal papers. Large molecules (avg 52.8 atoms). |
Preprocessing:
- Input resolution is fixed at $800 \times 800$ pixels.
- Images are virtually split into a $25 \times 25$ grid (625 patches total), where each patch is $32 \times 32$ pixels.
Algorithms
Encoder Logic:
- Grid Serialization: The $25 \times 25$ grid is flattened into a 1D sequence. 2D position information is concatenated to ResNet features before the Transformer.
- Auxiliary Losses: To aid convergence, classifiers on the encoder predict three things per patch: (1) number of atoms, (2) characters in atom labels, and (3) edge-sharing neighbors. These losses decrease to zero during training.
Decoder Logic:
- Auto-regressive Generation: At step $t$, the decoder generates a new node and connects it to existing nodes.
- Attention Modulation: Attention weights are transformed using bond information: $$ \begin{aligned} \text{Att}(Q, K, V) = \text{softmax} \left( \frac{\Gamma \odot (QK^T) + B}{\sqrt{d_k}} \right) V \end{aligned} $$ where $(\gamma_{ij}, \beta_{ij}) = f(e_{ij})$, with $e_{ij}$ being the edge type (in one-hot representation) between nodes $i$ and $j$, and $f$ is a multi-layer perceptron. $\Gamma$ and $B$ are matrices whose elements at position $(i, j)$ are $\gamma_{ij}$ and $\beta_{ij}$, respectively.
- Coordinate Prediction: The decoder outputs coordinates for each atom, which acts as a mechanism to track attention history.
Models
- Image Encoder: ResNet-34 backbone followed by a Transformer encoder.
- Graph Decoder: A “Graph-Aware Transformer” (GRAT) that outputs nodes (atom labels, coordinates) and edges (bond types).
Evaluation
Metrics focus on structural identity, as standard string matching (SMILES) is insufficient for graphs with superatoms.
| Metric | Description | Notes |
|---|---|---|
| SMI | Canonical SMILES Match | Correct if predicted SMILES is identical to ground truth. |
| TS 1 | Tanimoto Similarity = 1.0 | Ratio of predictions with perfect fingerprint overlap. |
| Sim. | Average Tanimoto Similarity | Measures average structural overlap across all predictions. |
Reproducibility
The paper does not release source code, pre-trained models, or the custom OLED evaluation dataset. The training data sources (PubChem, USPTO) are publicly available, but the specific image generation pipeline (modified RDKit with coordinate extraction and superatom substitution) is not released. Key architectural details (ResNet-34 backbone, Transformer encoder/decoder configuration) and training techniques are described, but exact hyperparameters for full reproduction are limited.
| Artifact | Type | License | Notes |
|---|---|---|---|
| PubChem | Dataset | Public Domain | Source of 4.6M molecules for synthetic image generation |
| USPTO | Dataset | Public Domain | 2.5M real image-molecule pairs from patents |
| RDKit | Code | BSD-3-Clause | Used (with modifications) for synthetic image generation |