Paper Information
Citation: Yoo, S., Kwon, O., & Lee, H. (2022). Image-to-Graph Transformers for Chemical Structure Recognition. arXiv preprint arXiv:2202.09580. https://doi.org/10.48550/arXiv.2202.09580
Publication: arXiv 2022
Contribution and Taxonomic Classification
This is a Method paper. It proposes a novel deep learning architecture designed to extract molecular structures from images by directly predicting the graph topology. The paper validates this approach through ablation studies (comparing ResNet-only baselines to the Transformer-augmented model) and extensive benchmarking against existing tools.
The Challenge with SMILES and Non-Atomic Symbols
- Handling Abbreviations: Chemical structures in scientific literature often use non-atomic symbols (superatoms like “R” or “Ph”) to reduce complexity. Standard tools that generate SMILES strings fail here because SMILES syntax does not support arbitrary non-atomic symbols.
- Robustness to Style: Existing rule-based tools are brittle to the diverse drawing styles found in literature.
- Data Utilization: Pixel-wise graph recognition tools (like ChemGrapher) require expensive pixel-level labeling. An end-to-end approach can utilize massive amounts of image-molecule pairs (like USPTO data) without needing exact coordinate labels.
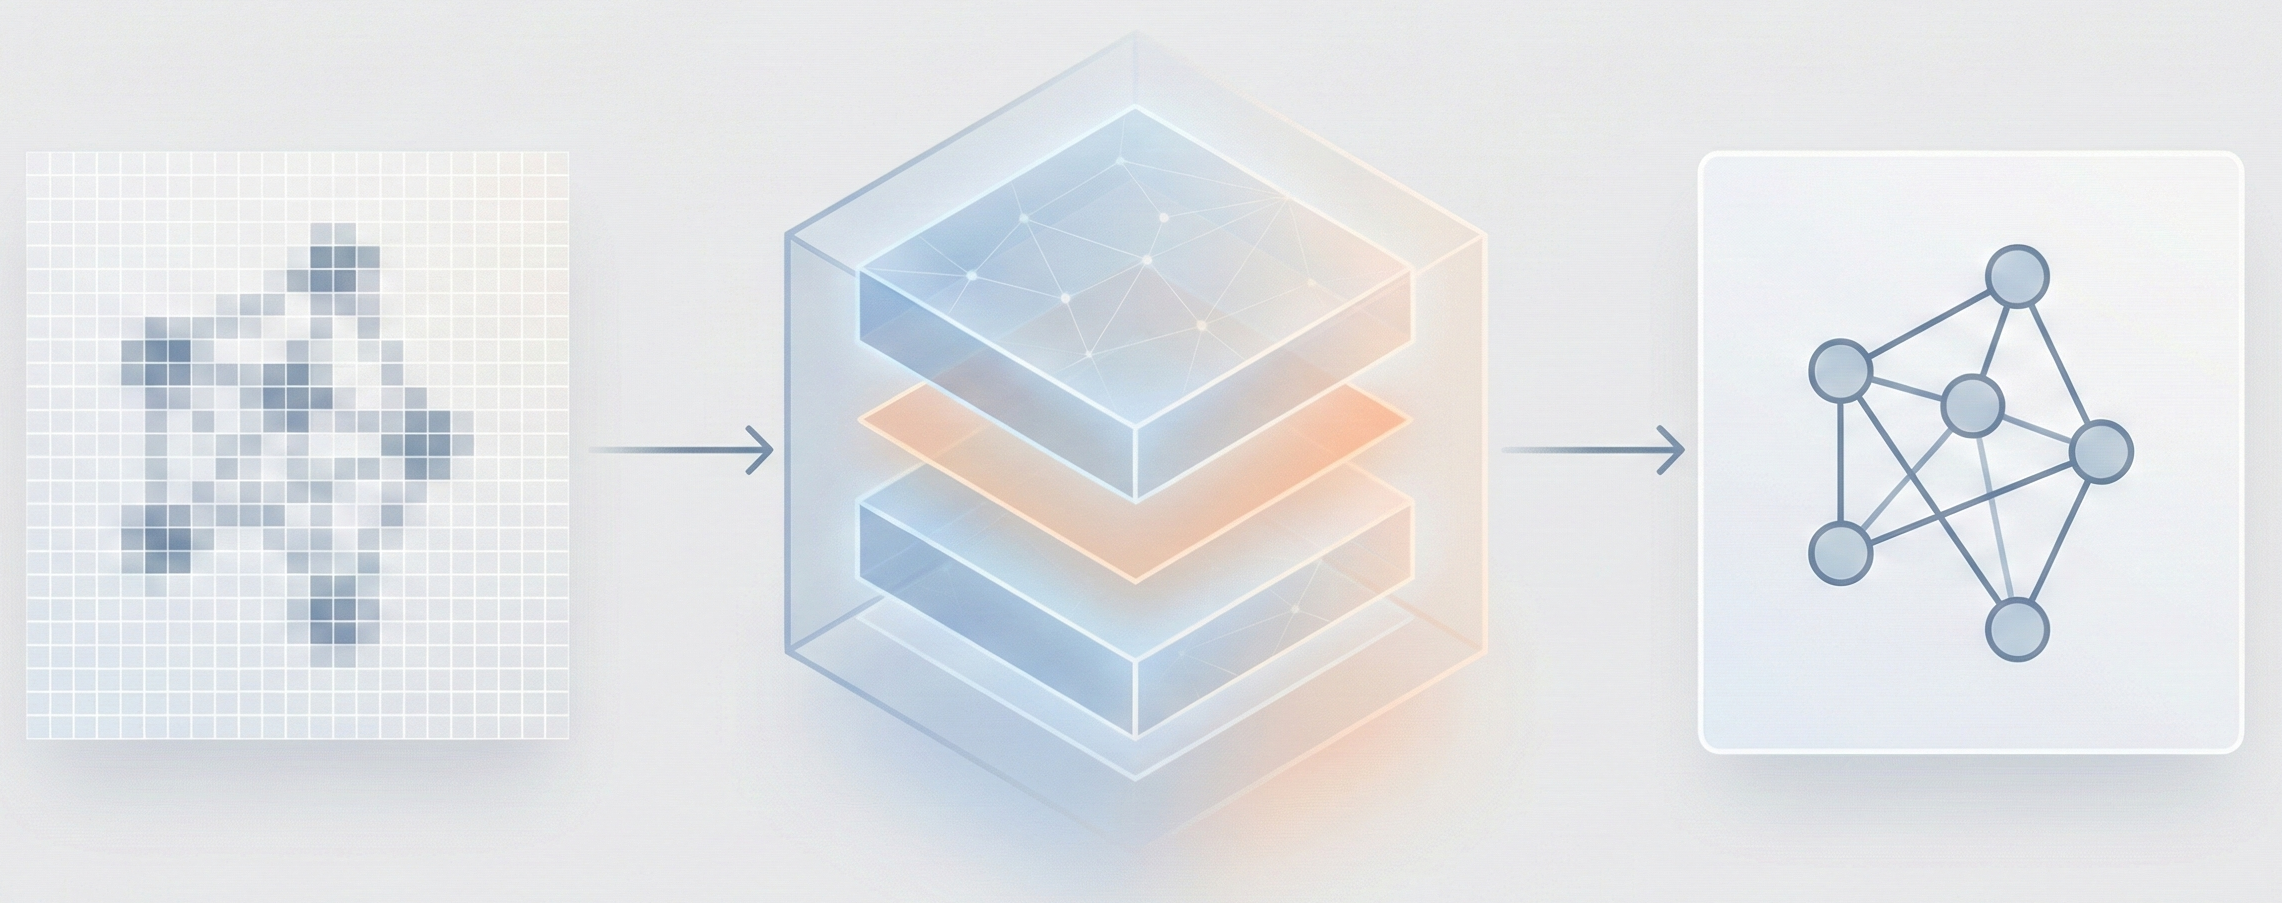
The Image-to-Graph (I2G) Architecture
The core novelty is the Image-to-Graph (I2G) architecture that bypasses string representations entirely:
- Hybrid Encoder: Combines a ResNet backbone (for locality) with a Transformer encoder (for global context), allowing the model to capture relationships between atoms that are far apart in the image.
- Graph Decoder (GRAT): A modified Transformer decoder that generates the graph auto-regressively. It uses feature-wise transformations to modulate attention weights based on edge information (bond types).
- Coordinate-Aware Training: The model is forced to predict the exact 2D coordinates of atoms in the source image, which significantly boosts accuracy by grounding the decoder’s attention.
Experimental Setup and Baselines
- Baselines: The model was compared against OSRA (rule-based), MolVec (rule-based), and ChemGrapher (deep learning pixel-wise).
- Benchmarks: Evaluated on four standard datasets: UoB, USPTO, CLEF, and JPO. Images were converted to PDF and back to simulate degradation.
- Large Molecule Test: A custom dataset (OLED) was created from 12 journal papers (434 images) to test performance on larger, more complex structures (average 52.8 atoms).
- Ablations: The authors tested the impact of the Transformer encoder, auxiliary losses, and coordinate prediction.
Empirical Results and Robustness
- SOTA Performance: The proposed model outperformed existing models with a 17.1% relative improvement on benchmark datasets.
- Robustness: On large molecules (OLED dataset), it achieved a 12.8% relative improvement.
- Data Scaling: Adding real-world USPTO data to the synthetic training set improved performance by 20.5%, demonstrating the model’s ability to learn from noisy, unlabeled coordinates.
- Handling Superatoms: The model successfully recognized pseudo-atoms (e.g., $R_1$, $R_2$) as distinct nodes, whereas SMILES-based tools collapsed them into generic “Any” atoms.
Reproducibility Details
Data
The authors used a combination of synthetic and real-world data for training.
| Purpose | Dataset | Size | Notes |
|---|---|---|---|
| Training | PubChem | 4.6M | Synthetic images generated using RDKit. Random superatoms (e.g., $CF_3$, $NO_2$) were substituted to simulate abbreviations. |
| Training | USPTO | 2.5M | Real image-molecule pairs from patents. Used for robustness; lacks coordinate labels. |
| Evaluation | Benchmarks | ~5.7k | UoB, USPTO, CLEF, JPO. Average ~15.8 atoms per molecule. |
| Evaluation | OLED | 434 | Manually segmented from 12 journal papers. Large molecules (avg 52.8 atoms). |
Preprocessing:
- Input resolution is fixed at $800 x800$ pixels.
- Images are virtually split into a $25 x25$ grid (625 patches total), where each patch is $32 x32$ pixels.
Algorithms
Encoder Logic:
- Grid Serialization: The $25 x25$ grid is flattened into a 1D sequence. 2D position information is concatenated to ResNet features before the Transformer.
- Auxiliary Losses: To aid convergence, classifiers on the encoder predict three things per patch: (1) number of atoms, (2) characters in atom labels, and (3) edge-sharing neighbors. These losses decrease to zero during training.
Decoder Logic:
- Auto-regressive Generation: At step $t$, the decoder generates a new node and connects it to existing nodes.
- Attention Modulation: Attention weights are transformed using bond information: $$ \begin{aligned} \text{Att}(Q, K, V) = \text{softmax} \left( \frac{QK^T}{\sqrt{d}} \odot \gamma(e_{ij}) + \beta(e_{ij}) \right) V \end{aligned} $$ where $e_{ij}$ is the edge type.
- Coordinate Prediction: The decoder outputs coordinates for each atom, which acts as a mechanism to track attention history.
Models
- Image Encoder: ResNet-34 backbone followed by a Transformer encoder.
- Graph Decoder: A “Graph-Aware Transformer” (GRAT) that outputs nodes (atom labels, coordinates) and edges (bond types).
Evaluation
Metrics focus on structural identity, as standard string matching (SMILES) is insufficient for graphs with superatoms.
| Metric | Description | Notes |
|---|---|---|
| SMI | Canonical SMILES Match | Correct if predicted SMILES is identical to ground truth. |
| TS 1 | Tanimoto Similarity = 1.0 | Ratio of predictions with perfect fingerprint overlap. |
| Sim. | Average Tanimoto Similarity | Measures average structural overlap (cutoff usually > 0.85). |