Paper Information
Citation: Gkoutos, G. V., Rzepa, H., Clark, R. M., Adjei, O., & Johal, H. (2003). Chemical Machine Vision: Automated Extraction of Chemical Metadata from Raster Images. Journal of Chemical Information and Computer Sciences, 43(5), 1342-1355. https://doi.org/10.1021/ci034017n
Publication: J. Chem. Inf. Comput. Sci. 2003
Paper Classification: Methodological Approach
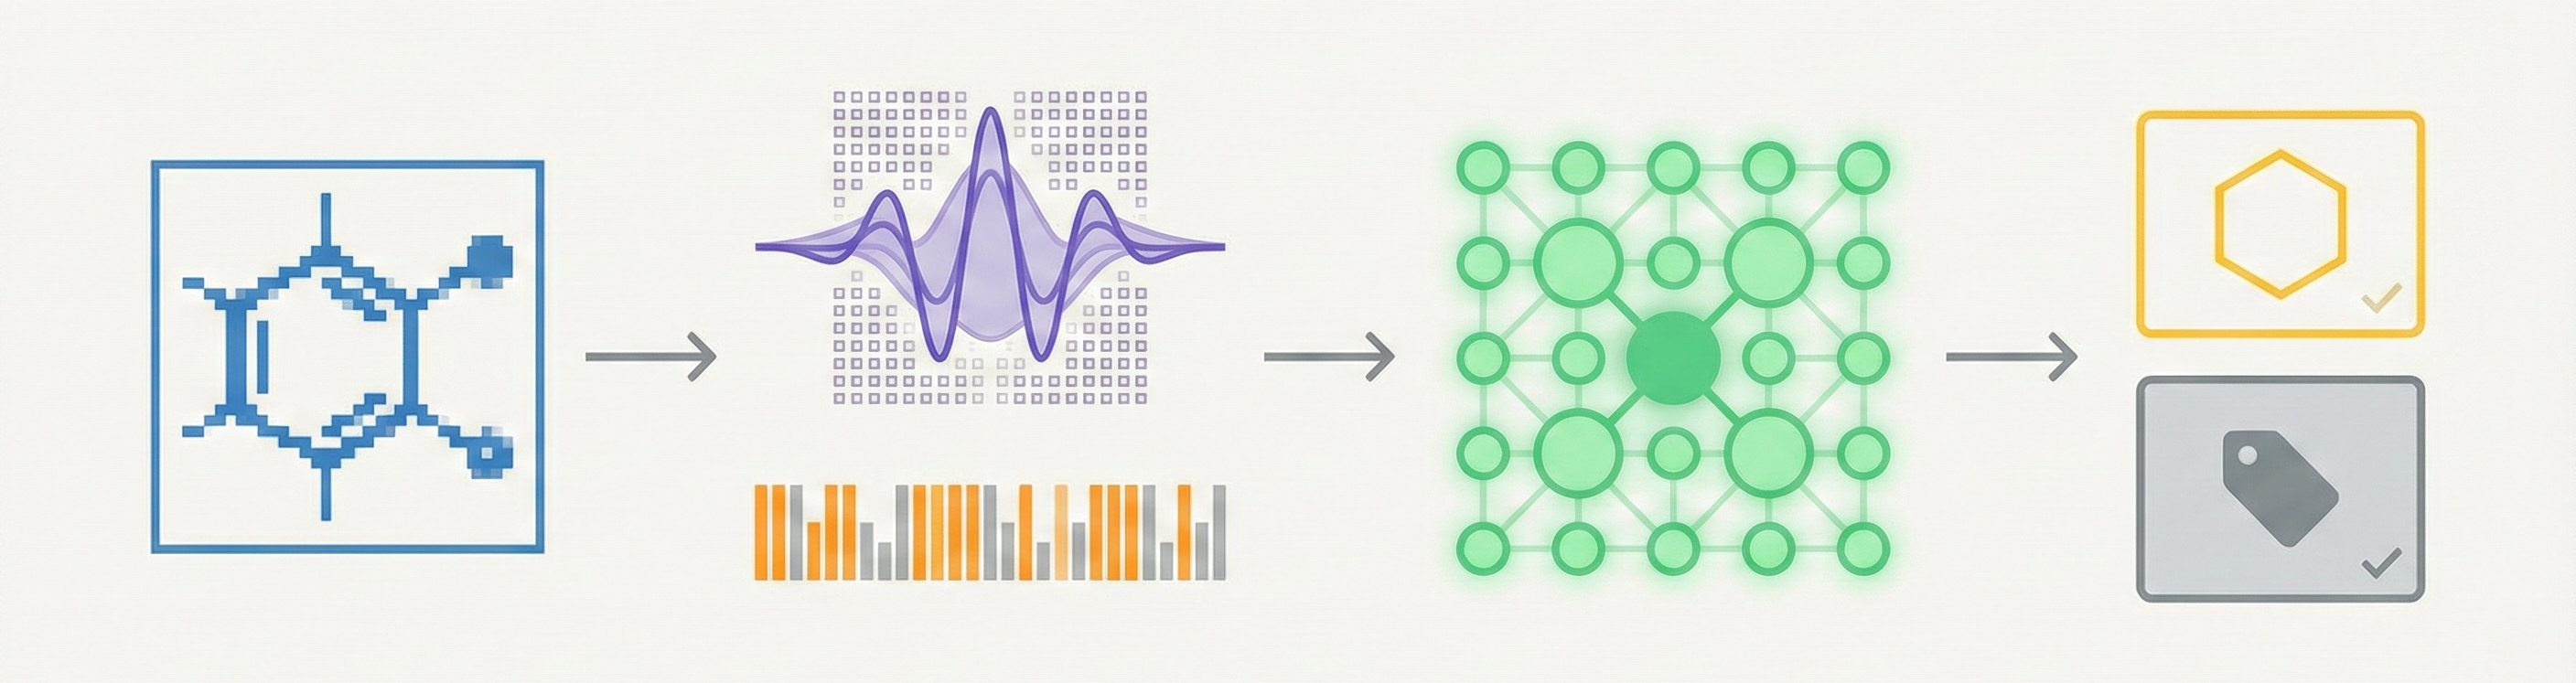
This is a Method paper. It proposes a novel architectural pipeline applying “machine vision” techniques (Gabor wavelets and Kohonen networks) to the problem of identifying chemical diagrams in low-resolution raster images. The paper focuses on the “how” (the algorithm and its parameters) and validates the method through quantitative experiments optimizing feature vectors and masks.
Motivation: Extracting Legacy Chemical Data
The primary motivation is to unlock the “large amount of data” trapped in legacy raster images (GIF, JPEG) on the Web that lack semantic metadata.
- Legacy Data Problem: Most chemical structural information on the Web is embedded in raster images, not machine-readable formats like Molfiles.
- Limitations of Existing Tools: Previous tools like Kekule and CLiDE acted as “Chemical OCR,” attempting to reconstruct exact atom-bond connections. This required high-resolution images (>300 dpi) and human intervention, making them unsuitable for automated Web crawling of low-resolution (72-96 dpi) images.
- Goal: To create a low-cost, automated tool for a “robot-based Internet resource discovery tool” that can classify images (e.g., “is this a molecule?”).
Core Innovation: Texture Recognition over Structural OCR
The core novelty is the shift from “Optical Character Recognition” (exact reconstruction) to “Texture Recognition” (classification).
- Texture-Based Approach: The authors treat chemical diagrams as textures. They use Gabor wavelets to extract texture features. Crucially, this system does not recognize specific chemical structures (i.e., atom-bond connectivity tables, SMILES, or Molfiles). It only classifies images into broad categories.
- Incremental Learning: The system uses a Kohonen Self-Organizing Feature Map (KSOFM) combined with Class Boundary Analysis (CBA). This allows for “incremental learning,” where new classes (e.g., aromatic vs. non-aromatic) can be added without retraining the entire system.
- Optimization for Chemistry: The authors identify specific parameters (frequency channels, mask sizes) that are optimal for the “texture” of chemical diagrams.
- Integration with ChemDig: The method was designed to feed into ChemDig, a robot-based index engine for automated web crawling and metadata generation.
Experimental Setup: Parameter Optimization
The authors performed optimization and validation experiments using a dataset of 300 images divided into three classes: Ring Systems, Non-Ring Systems, and Non-Chemistry (textures, biological figures, etc.).
- Parameter Optimization: They systematically varied hyperparameters to find the optimal configuration:
- Feature Vector Size: Tested sizes from 100 to 4000 elements.
- Energy Mask Size: Tested windows from $3 \times 3$ to $15 \times 15$ pixels.
- Frequency Channels: Tested seven spatial frequencies ($\sqrt{2}$ to $64\sqrt{2}$).
- Classification Performance: Evaluated the system’s ability to classify unseen test images using a 50:50 training/test split.
- Comparison: Qualitatively compared the approach against vectorization tools (Autotrace, CR2V).
Results: Robust Classification of Low-Resolution Images
- Optimal Configuration: The system performed best with a feature vector size of ~1500 elements, a $9 \x9$ energy mask, and frequency channel $4\sqrt{2}$.
- High Accuracy: Achieved a recognition rate of 91% with a 50:50 training/test split, and up to 92% with a 70:30 split.
- Robustness: The system successfully distinguished between chemical and non-chemical images (zero false negatives for chemical images).
- Limitations: Misclassifications occurred between “ring” and “non-ring” systems when structures had similar visual “textures” (e.g., similar density or layout).
- Impact: The method is viable for automating metadata generation (e.g.,
alttags) for web crawlers, functioning as a coarse-grained filter before more expensive processing.
Reproducibility Details
Data
The study used a custom dataset of raster images collected from the Web.
| Purpose | Dataset | Size | Notes |
|---|---|---|---|
| Training/Eval | Custom Web Dataset | 300 images | Split into 3 classes: Ring Systems, Non-Ring Systems, Non-Chemistry. |
| Resolution | Low-Res Web Images | 72-96 dpi | Deliberately chosen to mimic Web conditions where OCR fails. |
| Format | Raster | GIF, JPEG | Typical web formats. |
Algorithms
The core pipeline consists of a Gabor Transform Unit followed by a Training/Classification Unit.
- Gabor Wavelets: Used for feature extraction. The 2D Gabor wavelet equation is:
$$h(x,y)=\exp\left{-\frac{1}{2}\left[\frac{x^{2}}{\sigma_{x}^{2}}+\frac{y^{2}}{\sigma_{y}^{2}}\right]\right}\cos(2\pi\mu_{\sigma}x+\phi)$$
- Bank Structure: 28 filters total (4 orientations $\times$ 7 radial frequencies).
- Orientations: $0^{\circ}, 45^{\circ}, 90^{\circ}, 135^{\circ}$.
- Frequencies: 1 octave apart, specifically $1\sqrt{2}, \dots, 64\sqrt{2}$.
- Selected Frequency: $4\sqrt{2}$ was found to be optimal for chemistry.
- Preprocessing:
- Buffer Mounting: Images are mounted in a buffer (set to 0) to handle edge artifacts.
- Look-Up-Tables (LUT/LUF): A binary Look-Up-Frame (LUF) indicates Regions of Interest (ROI) to avoid computing empty space; values are stored in a Look-Up-Table (LUT) to prevent re-computation of overlapping windows.
- Feature Extraction:
- Non-linear Thresholding: $\psi(t) = \tanh(\alpha t)$ with $\alpha = 0.25$.
- Energy Function: Calculated as average absolute deviation from the mean using a window $W_{xy}$. $$e_{k}(x,y)=\frac{1}{M^{2}}\sum_{(a,b)\in W_{xy}}|\psi(r_{k}(a,b))|$$
- Optimal Window: $9 \times 9$ pixels.
Models
The classification model relies on competitive learning.
- Architecture: Kohonen Self-Organizing Feature Map (KSOFM).
- Training:
- Learning Rate: Starts at 1.0, decreases to 0.1.
- Class Boundary Analysis (CBA): Computes the centroid (mean) and variance of each cluster. The variance defines the class boundary.
- Classification Metric: Euclidean Distance Norm. An unknown vector is classified based on the shortest distance to a cluster center, provided it falls within the variance boundary. $$D_{ij}=||x_{i}-x_{j}||$$
Evaluation
Performance was measured using recognition rate ($R_s$) and misclassification error ($E_s$).
| Metric | Value | Baseline | Notes |
|---|---|---|---|
| Recognition Rate | 91% | N/A | Achieved with 50:50 split. 92% with 70:30 split. |
| Feature Size | ~1500 | 4000 | Reducing vector size from 4000 to 1500 maintained ~80% accuracy while improving speed. |
Citation
@article{gkoutosChemicalMachineVision2003,
  title = {Chemical {{Machine Vision}}: {{Automated Extraction}} of {{Chemical Metadata}} from {{Raster Images}}},
  shorttitle = {Chemical {{Machine Vision}}},
  author = {Gkoutos, Georgios V. and Rzepa, Henry and Clark, Richard M. and Adjei, Osei and Johal, Harpal},
  year = 2003,
  month = sep,
  journal = {Journal of Chemical Information and Computer Sciences},
  volume = {43},
  number = {5},
  pages = {1342--1355},
  issn = {0095-2338},
  doi = {10.1021/ci034017n},
  urldate = {2025-12-15},
  langid = {english}
}