Bridging MD and TST for Surface Diffusion
This is primarily a Methodological Paper with a secondary contribution in Discovery.
The authors’ primary goal is to demonstrate the validity of the “dynamical corrections formalism” for calculating diffusion constants. They validate this by reproducing Molecular Dynamics (MD) results at high temperatures and then extending the method into low-temperature regimes where MD is infeasible.
By applying this method, they uncover a specific physical phenomenon, “bounce-back recrossings”, that causes a dip in the diffusion coefficient at low temperatures, a detail previously unobserved.
Timescale Limits in Molecular Dynamics
The authors aim to solve the timescale problem in simulating surface diffusion.
Limit of MD: Molecular Dynamics (MD) is effective at high temperatures but becomes computationally infeasible at low temperatures because the time between diffusive hops increases drastically.
Limit of TST: Standard Transition State Theory (TST) can handle long timescales but assumes all barrier crossings are successful, ignoring correlated dynamical events like immediate recrossings or multiple jumps.
Goal: They seek to apply a formalism that corrects TST using short-time trajectory data, allowing for accurate calculation of diffusion constants across the entire temperature range.
The Bounce-Back Mechanism
The core novelty is the rigorous application of the dynamical corrections formalism to a multi-site system (fcc/hcp sites) to characterize non-Arrhenius behavior at low temperatures.
Unified Approach: They demonstrate that this method works for all temperatures, bridging the gap between the “rare-event regime” and the high-temperature regime dominated by fluid-like motion.
Bounce-back Mechanism: They identify a specific “dip” in the dynamical correction factor ($f_d < 1$) at low temperatures ($T \approx 0.038$), attributed to trajectories where the adatom collides with a substrate atom on the far side of the binding site and immediately recrosses the dividing surface.
Simulating the Lennard-Jones fcc(111) Surface
The authors performed computational experiments on a Lennard-Jones fcc(111) surface cluster.
System Setup: A single adatom on a 3-layer substrate (30 atoms/layer) with periodic boundary conditions.
Baselines: They compared their high-temperature results against standard Molecular Dynamics simulations to validate the method.
Ablation of Substrate Freedom: They ran a control experiment with a 6-layer substrate (top 3 free, 800 trajectories) to confirm the bounce-back effect persisted independently of the fixed deep layers, obtaining $D/D^{TST} = 0.75 \pm 0.06$, consistent with the original result.
Trajectory Analysis: They analyzed the angular distribution of initial momenta to characterize the specific geometry of the bounce-back trajectories. Bounce-back trajectories were more strongly peaked at $\phi = 90°$ (perpendicular to the TST gate), confirming the effect arises from interaction with the substrate atom directly across the binding site.
Temperature Range: The full calculation spanned $0.013 \leq T \leq 0.383$ in reduced units, bridging the rare-event regime and the high-temperature fluid-like regime.
Resolving Non-Arrhenius Behavior
Arrhenius Behavior of TST: The uncorrected TST diffusion constant ($D^{TST}$) followed a near-perfect Arrhenius law, with a linear least-squares fit of $\ln(D^{TST}) = -1.8 - 0.30/T$.
High-Temperature Correction: At high T, the dynamical correction factor $D/D^{TST} > 1$, indicating correlated multiple forward jumps (long flights).
Low-Temperature Dip: At low T, $D/D^{TST} < 1$ for $T = 0.013, 0.026, 0.038, 0.051$ (minimum at $T = 0.038$), caused by the bounce-back mechanism.
Validation: The method successfully reproduced high-T literature values while providing access to low-T dynamics inaccessible to direct MD.
Reproducibility Details
Data
The paper does not use external datasets but generates simulation data based on the Lennard-Jones potential.
| Type | Parameter | Value | Notes |
|---|---|---|---|
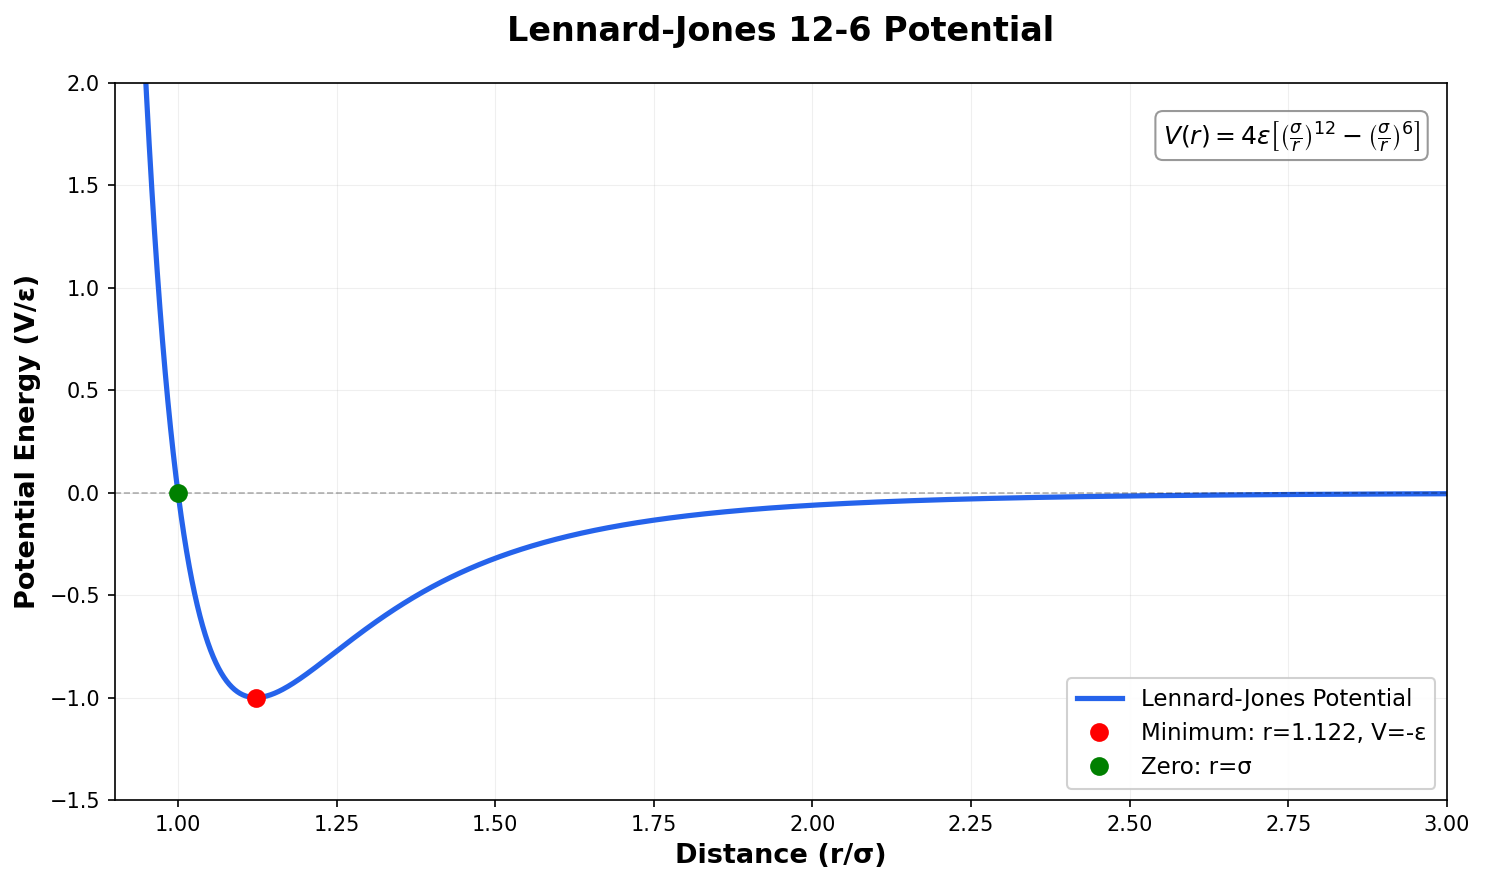
| Potential | $\epsilon, \sigma$ | 1.0 (Reduced units) | Standard Lennard-Jones 6-12 |
| Cutoff | Spline | $r_1=1.5\sigma, r_2=2.5\sigma$ | 5th-order spline smooths potential to 0 at $r_2$ |
| Geometry | Lattice Constant | $a_0 = 1.549$ | Minimum energy for this potential |
| Cluster | Size | 3 layers, 30 atoms/layer | Periodic boundary conditions parallel to surface |
Algorithms
The diffusion constant $D$ is calculated as $D = D^{TST} \times (D/D^{TST})$.
1. TST Rate Calculation ($D^{TST}$)
- Method: Monte Carlo integration of the flux through the dividing surface.
- Technique: Calculate free energy difference between the entire binding site and the TST dividing region.
- Dividing Surface: Defined geometrically with respect to equilibrium substrate positions (honeycomb boundaries around fcc/hcp sites).
2. Dynamical Correction Factor ($D/D^{TST}$)
The method relies on evaluating the dynamical correction factor $f_d$, initialized via a Metropolis walk restricted to the TST boundary region, computed as:
$$ \begin{aligned} f_d(i\rightarrow j) = \frac{2}{N}\sum_{I=1}^{N}\eta_{ij}(I) \end{aligned} $$
- Initialization:
- Position: Sampled via Metropolis walk restricted to the TST boundary region.
- Momentum: Maxwellian distribution for parallel components; Maxwellian-flux distribution for normal component.
- Symmetry: Trajectories entering hcp sites are generated by reversing momenta of those entering fcc sites.
- Integration:
- Integrator: Adams-Bashforth-Moulton predictor-corrector formulas of orders 1 through 12.
- Duration: Integrated until time $t > \tau_{corr}$ (approximately $\tau_{corr} \approx 13$ reduced time units).
- Sample Size: 1400 trajectories per temperature point (700 initially entering each type of site).
Models
- System: Single component Lennard-Jones solid (Argon-like).
- Adsorbate: Single adatom on fcc(111) surface.
- Substrate Flexibility: Adatom plus top layer atoms are free to move. Layers 2 and 3 are fixed. (Validation run used 6 layers with top 3 free).
Evaluation
The primary metric is the Diffusion Constant $D$, analyzed via the Dynamical Correction Factor.
| Metric | Value | Baseline | Notes |
|---|---|---|---|
| Slope ($E_a$) | 0.30 | 0.303 fcc / 0.316 hcp (Newton-Raphson) | TST slope in good agreement with static barrier height. |
| $D/D^{TST}$ (Low T) | $0.82 \pm 0.04$ | 1.0 (TST) | At $T=0.038$. Indicates 18% reduction due to recrossing. |
| $D/D^{TST}$ (High T) | $> 1.0$ | MD Literature | Increases with T due to multiple jumps. |
Hardware
Specific hardware configurations (e.g., node architectures, supercomputers) or training times were not specified in the original publication, which is typical for 1989 literature. Modern open-source MD engines (e.g., LAMMPS, ASE) could perform identical Lennard-Jones molecular dynamics integrations in negligible time on any consumer workstation.
Paper Information
Citation: Cohen, J. M., & Voter, A. F. (1989). Self-diffusion on the Lennard-Jones fcc(111) surface: Effects of temperature on dynamical corrections. The Journal of Chemical Physics, 91(8), 5082-5086. https://doi.org/10.1063/1.457599
Publication: The Journal of Chemical Physics 1989
@article{cohenSelfDiffusionLennard1989,
  title = {Self-diffusion on the {{Lennard}}-{{Jones}} Fcc(111) Surface: {{Effects}} of Temperature on Dynamical Corrections},
  shorttitle = {Self-diffusion on the {{Lennard}}-{{Jones}} Fcc(111) Surface},
  author = {Cohen, J. M. and Voter, A. F.},
  year = {1989},
  month = oct,
  journal = {The Journal of Chemical Physics},
  volume = {91},
  number = {8},
  pages = {5082--5086},
  issn = {0021-9606, 1089-7690},
  doi = {10.1063/1.457599},
  langid = {english}
}