The Theoretical Foundation of Adsorption and Diffusion
This paper represents a foundational Theory contribution with dual elements of Systematization. It derives physical laws for adsorption potentials (Section 2) and diffusion kinetics (Section 4) from first principles, validating them against external experimental data (Ward, Benton). It bridges electronic structure theory (potential curves) and statistical mechanics (diffusion rates). It provides a unifying theoretical framework to explain a range of experimental observations.
Reconciling Physisorption and Chemisorption
The primary motivation was to reconcile conflicting experimental evidence regarding the nature of gas-solid interactions. At the time, it was observed that the same gas and solid could interact weakly at low temperatures (consistent with van der Waals forces) but exhibit strong, chemical-like bonding at higher temperatures, a process requiring significant activation energy. The paper seeks to provide a single, coherent model that can explain both “physical adsorption” (physisorption) and “activated” or “chemical adsorption” (chemisorption) and the transition between them.
Quantum Mechanical Potential Energy Surfaces for Adsorption
The core novelty is the application of quantum mechanical potential energy surfaces to the problem of surface adsorption. The key conceptual breakthroughs are:
Dual Potential Energy Curves: The paper proposes that the state of the system must be described by at least two distinct potential energy curves as a function of the distance from the surface:
- One curve represents the interaction of the intact molecule with the surface (e.g., H₂ with a metal). This corresponds to weak, long-range van der Waals forces.
- A second curve represents the interaction of the dissociated constituent atoms with the surface (e.g., 2H atoms with the metal). This corresponds to strong, short-range chemical bonds.
Activated Adsorption via Curve Crossing: The transition from the molecular (physisorbed) state to the atomic (chemisorbed) state occurs at the intersection of these two potential energy curves. For a molecule to dissociate and chemisorb, it must possess sufficient energy to reach this crossing point. This energy is identified as the energy of activation, which had been observed experimentally.
Unified Model: This model unifies physisorption and chemisorption into a single continuous process. A molecule approaching the surface is first trapped in the shallow potential well of the physisorption curve. If it acquires enough thermal energy to overcome the activation barrier, it can transition to the much deeper potential well of the chemisorption state. This provides a clear physical picture for temperature-dependent adsorption phenomena.
Quantum Mechanical Basis for Cohesion: To explain the nature of the chemisorption bond itself, Lennard-Jones draws on the then-recent quantum theory of metals (Sommerfeld, Bloch). In a metal, electrons are not bound to individual atoms but instead occupy shared energy states (bands) spread across the crystal. When an atom approaches the surface, local energy levels form in the gap between the bulk bands, creating sites where bonding can occur. The adsorption bond arises from the interaction between the valency electron of the approaching atom and conduction electrons of the metal, forming a closed shell analogous to a homopolar bond.
Validating Theory Against Experimental Gas-Solid Interactions
This is a theoretical paper with no original experiments performed by the author. However, Lennard-Jones validates his theoretical framework against existing experimental data from other researchers:
- Ward’s data: Hydrogen absorption on copper, used to validate the square root time law for slow sorption kinetics (§4)
- Activated adsorption experiments: Benton and White (hydrogen on nickel), Taylor and Williamson, and Taylor and McKinney all provided isobar data showing temperature-dependent transitions between adsorption types (§3). Garner and Kingman documented three distinct adsorption regimes at different temperatures.
- van der Waals constant data: Used existing measurements of diamagnetic susceptibility to calculate predicted heats of adsorption (e.g., argon on copper yielding approximately 6000 cal/gram atom, nitrogen roughly 2500 cal/gram mol, hydrogen roughly 1300 cal/gram mol)
- KCl crystal calculations: Computed the full attractive potential field of argon above a KCl crystal lattice, accounting for the discrete ionic structure to produce detailed potential energy curves at different surface positions (§2)
The validation approach involves deriving theoretical predictions from first principles and showing they match the functional form and magnitude of independently measured experimental results.
The Lennard-Jones Diagram and Activated Adsorption
Key Outcomes:
- The paper introduced the now-famous Lennard-Jones diagram for surface interactions, plotting potential energy versus distance from the surface for both molecular and dissociated atomic species. This graphical model became a cornerstone of surface science.
- Derived the square root time law ($S \propto \sqrt{t}$) for slow sorption kinetics, validated against Ward’s experimental data.
- Established quantitative connection between adsorption potentials and measurable atomic properties (diamagnetic susceptibility).
Conclusions:
- The nature of adsorption is determined by the interplay between two distinct potential states (molecular and atomic).
- “Activated adsorption” is the process of overcoming an energy barrier to transition from a physically adsorbed molecular state to a chemically adsorbed atomic state.
- The model predicts that the specific geometry of the surface (i.e., the lattice spacing) and the orientation of the approaching molecule are critical, as they influence the shape of the potential energy surfaces and thus the magnitude of the activation energy.
- The reverse process (recombination of atoms and desorption of a molecule) also requires activation energy to move from the chemisorbed state back to the molecular state.
- This entire mechanism is proposed as a fundamental factor in heterogeneous catalysis, where the surface acts to lower the activation energy for molecular dissociation, facilitating chemical reactions.
Limitations:
- The initial “method of images” derivation assumes a perfectly continuous conducting surface, an approximation that breaks down at the atomic orbital level close to the surface.
- While Lennard-Jones uses one-dimensional calculations to estimate initial potential well depths, he later qualitatively extends this to 3D “contour tunnels” to explain surface migration. However, these early geometric approximations lack the many-body, multi-dimensional complexity natively handled by modern Density Functional Theory (DFT) simulations.
Mathematical Derivations
Van der Waals Calculation (Section 2)
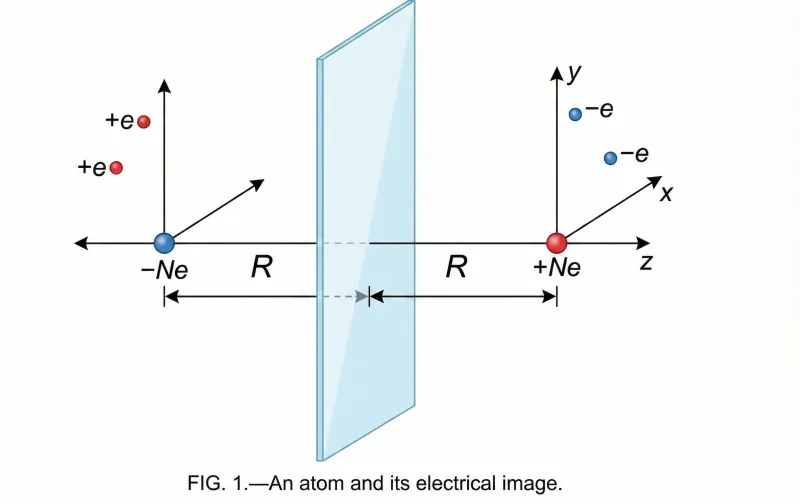
The paper derives the attractive force between a neutral atom and a metal surface using the classical method of electrical images. The key steps are:
- Method of Images: Lennard-Jones models the metal as a continuum of perfectly mobile electric fluid (a perfectly polarisable system). When a neutral atom approaches, its instantaneous dipole moment induces image charges in the metal surface.
 and electrons (-e) at distance R from a conducting surface, with its electrical image reflected on the opposite side")
- The Interaction Potential: The resulting potential energy $W$ of an atom at distance $R$ from the metal surface is:
$$W = -\frac{e^2 \overline{r^2}}{6R^3}$$
where $\overline{r^2}$ is the mean square distance of electrons from the nucleus.
- Connection to Measurable Properties: This theoretical potential can be calculated using diamagnetic susceptibility ($\chi$). The interaction simplifies to:
$$W = \mu R^{-3}$$
where $\mu = mc^2\chi/L$, with $m$ the electron mass, $c$ the speed of light, $\chi$ the diamagnetic susceptibility, and $L$ Loschmidt’s number ($6.06 \times 10^{23}$). This connects the adsorption potential to measurable magnetic properties of the atom.
- Repulsive Forces and Equilibrium: By assuming repulsive forces account for approximately 40% of the potential at equilibrium, Lennard-Jones estimates heats of adsorption. For argon on copper, this yields approximately 6000 cal per gram atom. Similar calculations give roughly 2500 cal/gram mol for nitrogen on copper and 1300 cal/gram mol for hydrogen.
Kinetic Theory of Slow Sorption (Section 4)
The paper extends beyond surface phenomena to model how gas enters the bulk solid (absorption). This section is critical for understanding time-dependent adsorption kinetics.
The “Cracks” Hypothesis
Lennard-Jones proposes that “slow sorption” is lateral diffusion along surface cracks (fissures between microcrystal boundaries) in the solid. The outer surface presents not a uniform plane but a network of narrow, deep crevasses where gas can penetrate. This reframes the problem: the rate-limiting step is diffusion along these crack walls, explaining why sorption rates differ from predictions based on bulk diffusion coefficients.
The Diffusion Equation
The problem is formulated using Fick’s second law:
$$\frac{\partial n}{\partial t} = D \frac{\partial^{2}n}{\partial x^{2}}$$
where $n$ is the concentration of adsorbed atoms, $t$ is time, $D$ is the diffusion coefficient, and $x$ is the position along the crack.
Derivation of the Diffusion Coefficient
The diffusion coefficient is derived from kinetic theory:
$$D = \frac{\bar{c}^2 \tau^2}{2\tau^*}$$
where:
- $\bar{c}$ is the mean lateral velocity of mobile atoms parallel to the surface
- $\tau$ is the time an atom spends in the mobile (activated) state
- $\tau^*$ is the interval between activation events
Atoms are “activated” to a mobile state with energy $E_0$, after which they can migrate along the surface.
The Square Root Law
Solving the diffusion equation for a semi-infinite crack yields the total amount of gas absorbed $S$ as a function of time:
$$S = 2n_0 \sqrt{\frac{Dt}{\pi}}$$
This predicts that absorption scales with the square root of time:
$$S \propto \sqrt{t}$$
Experimental Validation
Lennard-Jones validates this derivation by re-analyzing Ward’s experimental data on the Copper/Hydrogen system. Plotting the absorbed quantity against $\sqrt{t}$ produces linear curves, confirming the theoretical prediction. From the slope of the $\log_{10}(S^2/q^2t)$ vs. $1/T$ plot, Ward determined an activation energy of 14,100 cal per gram-molecule for the surface diffusion process.
Surface Topography and 3D Contours
The notes above imply a one-dimensional process (distance from surface). The paper explicitly expands this to three dimensions to explain surface migration.
Potential “Tunnels”
Lennard-Jones models the surface potential as 3D contour surfaces resembling “underground caverns” or tunnels. The potential energy landscape above a crystalline surface has periodic minima and saddle points.
Surface Migration
Atoms migrate along “tunnels” of low potential energy between surface atoms. The activation energy for surface diffusion corresponds to the barrier height between adjacent potential wells on the surface. This geometric picture explains:
- Why certain crystallographic orientations are more reactive
- The temperature dependence of surface diffusion rates
- The role of surface defects in catalysis
Reproducibility
This is a 1932 theoretical paper with no associated code, datasets, or models. The mathematical derivations are fully presented in the text and can be followed from first principles. The experimental data referenced (Ward’s copper/hydrogen measurements, Benton and White’s nickel/hydrogen isobars) are cited from independently published sources. No computational artifacts exist.
- Status: Closed (theoretical paper, no reproducibility artifacts)
- Hardware: N/A (analytical derivations only)
Paper Information
Citation: Lennard-Jones, J. E. (1932). Processes of Adsorption and Diffusion on Solid Surfaces. Transactions of the Faraday Society, 28, 333-359. https://doi.org/10.1039/tf9322800333
Publication: Transactions of the Faraday Society, 1932
@article{lennardjones1932processes,
  title={Processes of adsorption and diffusion on solid surfaces},
  author={Lennard-Jones, John Edward},
  journal={Transactions of the Faraday Society},
  volume={28},
  pages={333--359},
  year={1932},
  publisher={Royal Society of Chemistry}
}