Systematic Benchmarking of SMILES Data Augmentation
This is an Empirical paper that systematically evaluates how SMILES augmentation affects deep learning molecular property prediction. The primary contribution is a comprehensive comparison of five augmentation strategies across three neural network architectures and four datasets, producing the “Maxsmi” models that maximize prediction performance. The study also demonstrates that test-time augmentation provides a practical confidence measure for predictions.
The Data Scarcity Problem in QSAR Modeling
Deep learning models require large training sets to perform well, but experimental physico-chemical and bioactivity datasets remain small, typically ranging from hundreds to a few thousand compounds. SMILES augmentation, where the non-unique SMILES representation of a molecule is exploited to generate multiple training examples per compound, has been shown to help in prior work by Bjerrum (2017), Kimber et al. (2018), and Li and Fourches (2020). However, no prior study had systematically compared different augmentation strategies, analyzed how much augmentation is needed, or examined the relationship between augmentation factor and prediction confidence. Most previous work chose augmentation numbers a priori without justification. Maxsmi fills this gap by providing a systematic analysis and practical guidelines.
Five Augmentation Strategies and Test-Time Ensemble Learning
The core insight is twofold. First, the authors define five distinct strategies for generating augmented SMILES:
- No augmentation: use only the canonical SMILES (baseline)
- Augmentation with duplication: generate $m$ random SMILES per compound, allowing duplicates; dataset grows to $N \times m$
- Augmentation without duplication: generate $m$ random SMILES and discard exact duplicates
- Augmentation with reduced duplication: keep only $f(m) = \sqrt{m}$ copies of each duplicate, a compromise between the above
- Augmentation with estimated maximum: sample random SMILES until the same string has been generated 10 times, attempting to cover most of the valid SMILES space
Second, the authors formalize test-time augmentation as ensemble learning. Given a trained model $M_{\Theta}$, each test compound $C$ is represented by $k$ random SMILES $S_1(C), \ldots, S_k(C)$. The per-SMILES predictions are:
$$ \hat{y}_i(C) = M_{\Theta}(S_i(C)) $$
The compound-level prediction is an aggregation (mean) over these:
$$ \hat{y}(C) = A\big(\hat{y}_1(C), \ldots, \hat{y}_k(C)\big) $$
The standard deviation of the per-SMILES predictions serves as a confidence measure: high variance indicates the model is uncertain about a compound.
Experimental Design: Three Architectures, Four Datasets
Datasets
| Dataset | Size (after preprocessing) | Train / Test | Task | Provenance |
|---|---|---|---|---|
| ESOL | 1,128 | 902 / 226 | Water solubility | MoleculeNet |
| ESOL_small | 1,068 | 854 / 214 | Solubility (max 25 heavy atoms) | MoleculeNet |
| FreeSolv | 642 | 513 / 129 | Hydration free energy | MoleculeNet |
| Lipophilicity | 4,199 | 3,359 / 840 | Octanol/water distribution | ChEMBL |
| Affinity (EGFR) | 5,849 | 4,679 / 1,170 | pIC50 against EGFR kinase | Kinodata |
Architectures
Three shallow neural networks are compared:
- CONV1D: 1D convolution (kernel size 10, stride 1) followed by two fully connected layers
- CONV2D: 2D convolution on the one-hot encoded SMILES matrix, followed by two fully connected layers
- RNN: LSTM layer followed by two fully connected layers (128 and 64 units)
All models are trained for 250 epochs with batch size 16, MSE loss, SGD optimizer, and learning rate 0.001. A Random Forest baseline with Morgan fingerprints (radius 2, length 1024) is also included.
Augmentation sweep
The augmentation number $m$ is varied from 1 to 20 (step 1) and from 20 to 100 (step 10) for three strategies (with, without, and reduced duplication). The estimated maximum strategy is tested on the smaller datasets. Both training and test sets receive the same augmentation.
Key Findings: Augmentation Consistently Improves RMSE
Augmentation always helps
Across all datasets and architectures, SMILES augmentation reduces test RMSE compared to the no-augmentation baseline. Performance improves sharply in the low augmentation range (1 to 10) and reaches a plateau around 40 to 70, after which additional augmentation provides diminishing returns.
Best models (Maxsmi)
| Dataset | Model | Augmentation Number | Strategy | Test RMSE |
|---|---|---|---|---|
| ESOL | CONV1D | 70 | Reduced duplication | 0.569 |
| FreeSolv | CONV1D | 70 | With duplication | 1.032 |
| Lipophilicity | CONV1D | 80 | Without duplication | 0.593 |
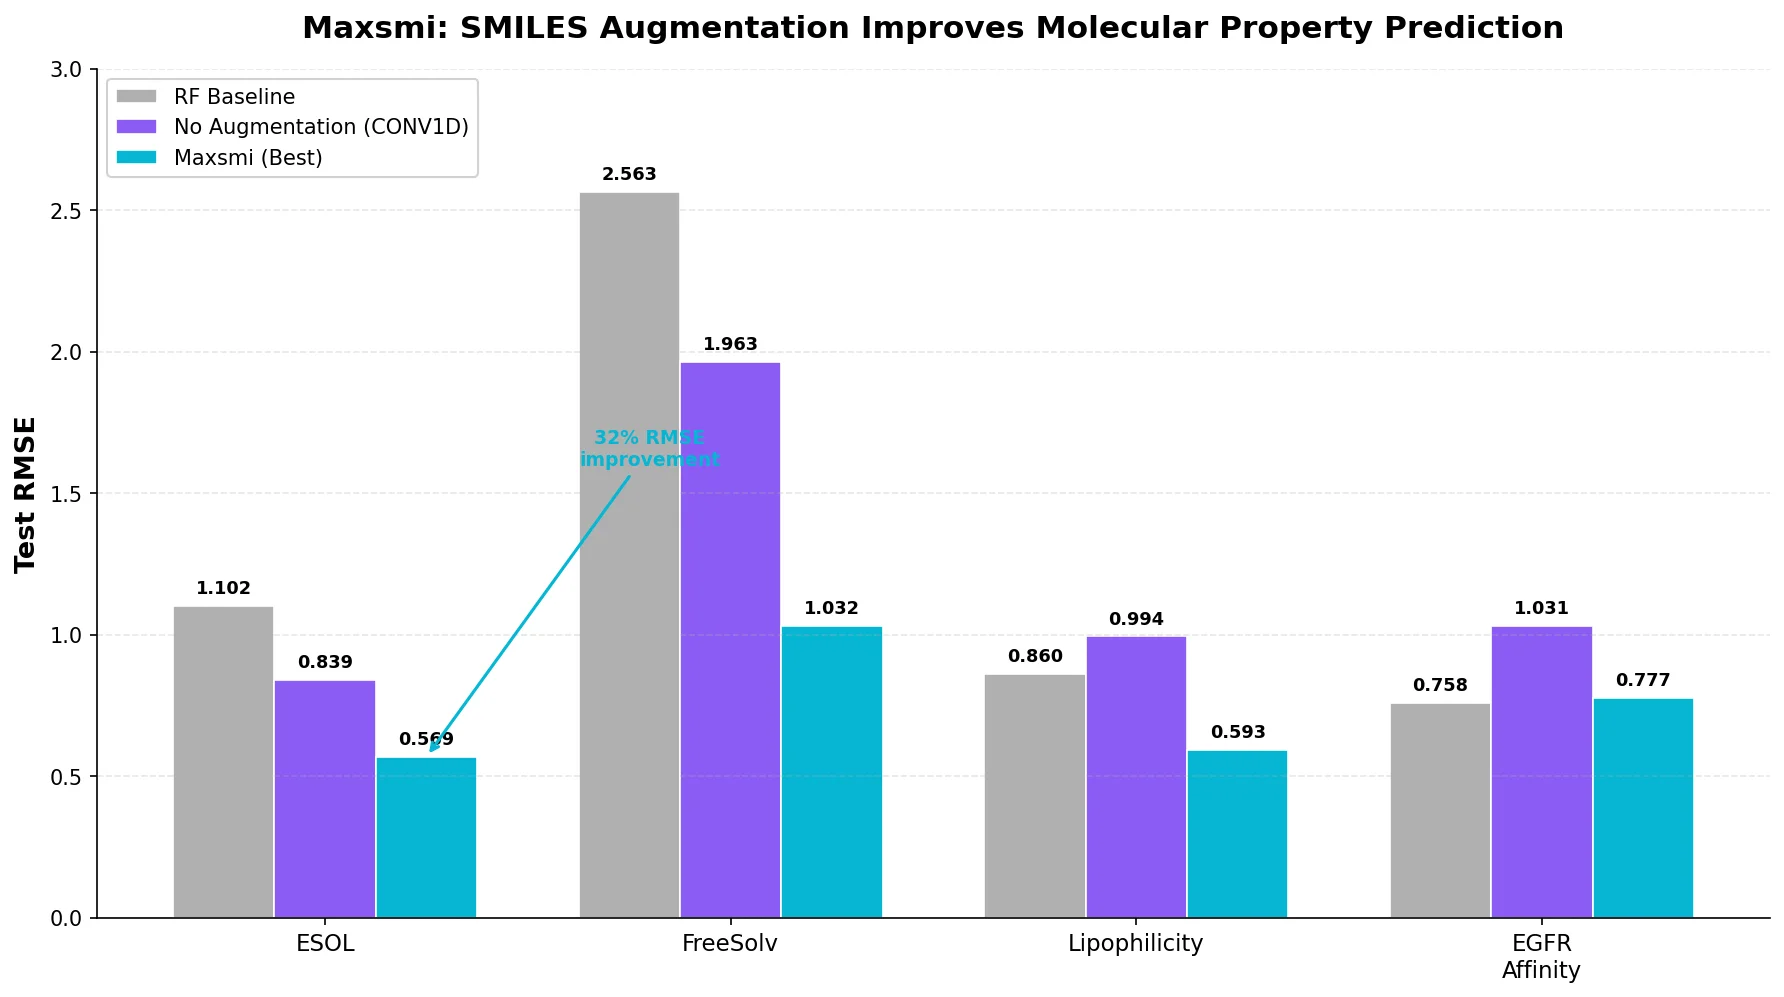
The CONV1D architecture consistently outperforms RNN and CONV2D. For ESOL, the CONV1D model improves from 0.839 RMSE (no augmentation) to 0.569 RMSE (70x reduced duplication), a 32% reduction.
No single best augmentation strategy
The three main augmentation strategies (with, without, and reduced duplication) perform similarly. Generating the estimated maximum number of unique SMILES does not yield the best results, suggesting a saturation point exists where additional SMILES diversity stops helping.
Canonical SMILES outperform single random SMILES
When augmentation is limited to a single representation ($m = 1$), the canonical SMILES consistently outperforms a single random SMILES. On ESOL with CONV1D, the canonical model achieves 0.839 RMSE versus 0.964 for a random SMILES. The authors attribute this to the simpler, more readable structure of canonical SMILES (fewer branches and brackets).
Comparison to prior work
| Study | ESOL | FreeSolv | Lipophilicity | Model |
|---|---|---|---|---|
| Maxsmi | 0.569 | 1.032 | 0.593 | CNN |
| MoleculeNet | 0.58 +/- 0.03 | 1.15 +/- 0.12 | 0.655 +/- 0.036 | GNN |
| CNF | 0.62 | 1.11 | 0.67 | CNN |
| MolPMoFiT | N/A | 1.197 +/- 0.127 | 0.565 +/- 0.037 | RNN |
Maxsmi outperforms or matches MoleculeNet’s graph neural networks and the CNF model on all three tasks. MolPMoFiT slightly outperforms Maxsmi on lipophilicity (0.565 vs 0.593) but performs worse on FreeSolv.
Confidence estimation
The standard deviation of per-SMILES predictions correlates with prediction error. Confidence curves show that sequentially removing compounds with the highest uncertainty leads to monotonically decreasing mean prediction error. For ESOL, keeping only the top 10% most confident predictions yields errors below 0.25.
EGFR affinity test case
Applying the Maxsmi approach (CONV1D, 70x augmentation, reduced duplication) to EGFR kinase affinity prediction yields test RMSE of 0.777 and R2 of 0.712, compared to 1.031 RMSE and 0.494 R2 for the canonical model (a 25% RMSE improvement). The Random Forest baseline (0.758 RMSE, 0.726 R2) performs comparably, which the authors note without further explanation.
Limitations
- All experiments use a single train/test split (80/20) without cross-validation, due to the computational cost of the full augmentation sweep. This means reported RMSE values lack uncertainty estimates for the Maxsmi models.
- The study uses shallow networks only. Whether the same augmentation benefits apply to deeper architectures or pre-trained models is untested.
- The EGFR test case shows the Random Forest baseline performing comparably to the Maxsmi model, raising questions about when SMILES augmentation provides a meaningful advantage over traditional fingerprint-based methods.
- The comparison to prior work uses different splits, preprocessing, and evaluation protocols across studies, which the authors acknowledge limits direct comparability.
Reproducibility Details
Data
| Purpose | Dataset | Size | Notes |
|---|---|---|---|
| Training/Evaluation | ESOL | 1,128 | MoleculeNet, water solubility |
| Training/Evaluation | FreeSolv | 642 | MoleculeNet, hydration free energy |
| Training/Evaluation | Lipophilicity | 4,199 | ChEMBL, logD |
| Test case | EGFR Affinity | 5,849 | Kinodata (ChEMBL v28), pIC50 |
All datasets are publicly available through MoleculeNet/DeepChem and Kinodata.
Algorithms
- SMILES generation via RDKit’s random SMILES enumeration
- One-hot encoding of SMILES characters with padding to max length
- Five augmentation strategies applied to both training and test sets
- Mean aggregation for compound-level predictions
Models
| Model | Architecture | Parameters |
|---|---|---|
| CONV1D | 1D conv (kernel 10, stride 1) + 2 FC layers | Not specified |
| CONV2D | 2D conv (single channel) + 2 FC layers | Not specified |
| RNN | LSTM + FC(128) + FC(64) | Not specified |
| RF Baseline | Random Forest (default sklearn) | Morgan FP, radius 2, length 1024 |
Training: 250 epochs, batch size 16, MSE loss, SGD, lr=0.001.
Evaluation
| Metric | Best Value | Baseline | Notes |
|---|---|---|---|
| RMSE (ESOL) | 0.569 | 1.102 (RF) | CONV1D, 70x reduced dup |
| RMSE (FreeSolv) | 1.032 | 2.563 (RF) | CONV1D, 70x with dup |
| RMSE (Lipophilicity) | 0.593 | 0.860 (RF) | CONV1D, 80x without dup |
| RMSE (EGFR) | 0.777 | 0.758 (RF) | CONV1D, 70x reduced dup |
Hardware
Training was performed on a GeForce GTX 1080 Ti, provided by the HPC cluster at Freie Universitat Berlin. Training CONV1D on ESOL with 100x augmentation (keeping duplicates, 90,200 data points) takes approximately 3 hours. Training with 19x augmentation achieves RMSE of 0.605 in under 30 minutes.
Artifacts
| Artifact | Type | License | Notes |
|---|---|---|---|
| volkamerlab/maxsmi | Code | MIT | Full source code, trained models, CLI for prediction |
| Documentation | Docs | N/A | Read the Docs documentation |
| Kinodata | Dataset | N/A | Curated kinase bioactivity data from ChEMBL v28 |
Reproducibility status: Highly Reproducible. Code, data, trained models, and a command-line prediction tool are all publicly available under the MIT license.
Paper Information
Citation: Kimber, T. B., Gagnebin, M., & Volkamer, A. (2021). Maxsmi: Maximizing molecular property prediction performance with confidence estimation using SMILES augmentation and deep learning. Artificial Intelligence in the Life Sciences, 1, 100014. https://doi.org/10.1016/j.ailsci.2021.100014
@article{kimber2021maxsmi,
  title={Maxsmi: Maximizing molecular property prediction performance with confidence estimation using SMILES augmentation and deep learning},
  author={Kimber, Talia B. and Gagnebin, Maxime and Volkamer, Andrea},
  journal={Artificial Intelligence in the Life Sciences},
  volume={1},
  pages={100014},
  year={2021},
  publisher={Elsevier},
  doi={10.1016/j.ailsci.2021.100014}
}