A Large-Scale Empirical Study of Molecular Property Prediction
This is an Empirical paper that systematically benchmarks molecular property prediction across multiple dimensions: molecular representations, model architectures, evaluation metrics, data splitting strategies, and chemical space generalization. The primary contribution is a rigorous, large-scale comparison (62,820 trained models) showing that traditional machine learning models on fixed molecular representations frequently outperform recent deep representation learning approaches, and that several overlooked evaluation factors (statistical testing, metric choice, activity cliffs, dataset size) significantly influence conclusions about model performance.
Motivation: Overlooked Evaluation Pitfalls in Molecular Property Prediction
Molecular property prediction is a core task in AI-driven drug discovery, and recent years have seen a proliferation of representation learning methods (transformers on SMILES, GNNs on molecular graphs) claiming improved performance on MoleculeNet benchmark datasets. However, the authors identify several systemic problems in how these methods are evaluated:
- Heavy reliance on MoleculeNet benchmarks, which may not reflect real-world drug discovery challenges. Some benchmark tasks (e.g., SIDER, ClinTox) are arguably unreasonable because they try to predict outcomes from chemical structure alone when other factors (food-drug interactions, patient-level variables) dominate.
- Lack of statistical rigor. Most papers report mean metrics over 3 or 10 splits without statistical tests. Without rigorous analysis, improved metrics could be statistical noise.
- Inconsistent data splits. Across studies, the actual splits vary because seeds and splitting implementations differ, making cross-paper comparisons unreliable.
- Inappropriate metrics. AUROC, the default for classification, can overestimate performance, especially on imbalanced datasets. Precision-oriented metrics (PPV, NPV) may be more relevant for virtual screening.
- Neglect of activity cliffs. Most studies only evaluate inter-scaffold generalization via scaffold splits, ignoring intra-scaffold generalization where structurally similar molecules exhibit drastically different activities (activity cliffs).
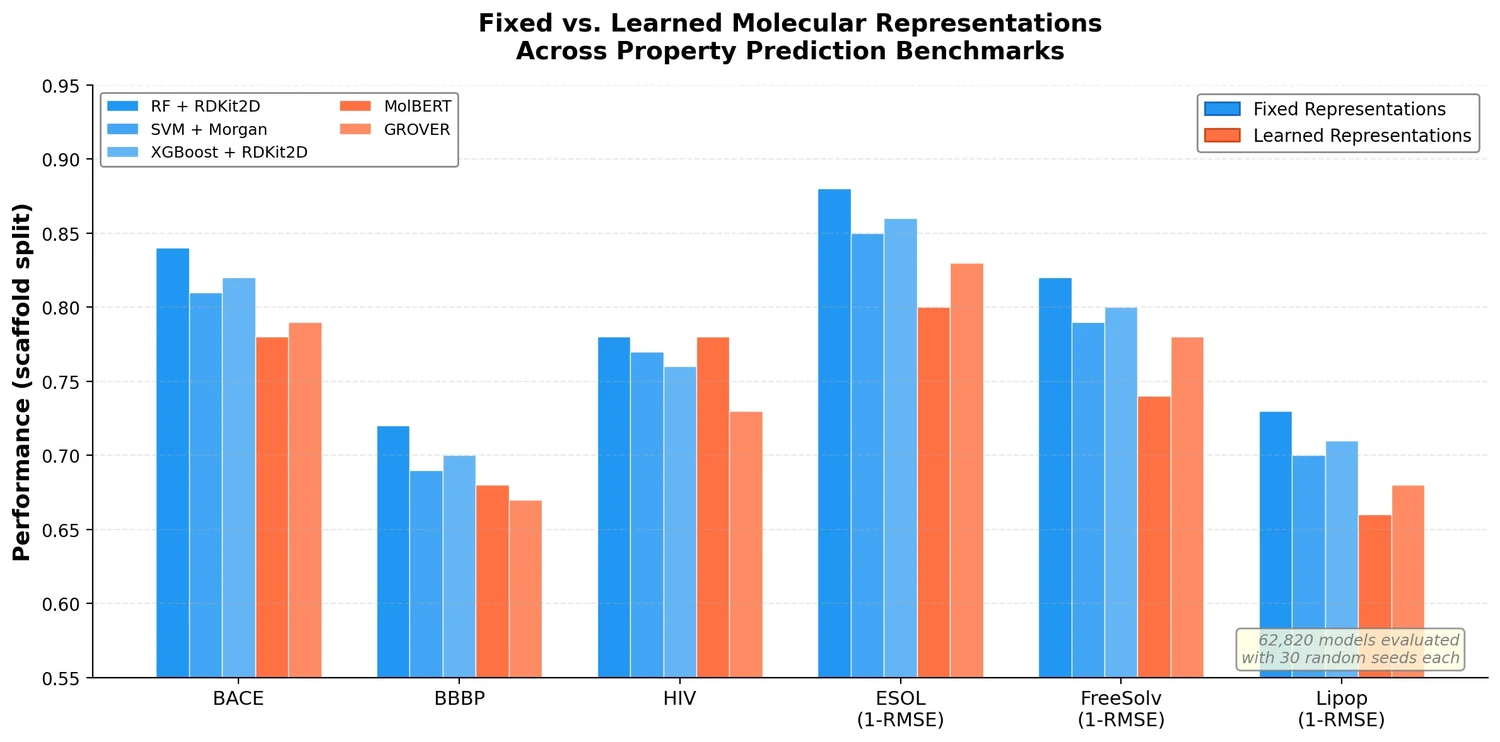
Core Contribution: Fixed Representations Often Outperform Learned Representations
The central finding is that traditional ML models (RF, SVM, XGBoost) operating on fixed molecular representations (RDKit2D descriptors, Morgan fingerprints, MACCS keys, AtomPairs) frequently outperform recent self-supervised pretrained models (MolBERT, GROVER) across diverse datasets. The authors frame the paper around a central thesis:
“A model cannot save an unqualified dataset which cannot remedy an improper evaluation for an ambiguous chemical space generalization claim.”
Key findings on representations and models:
- RF on RDKit2D descriptors achieves the best performance on BACE, BBBP, ESOL, and Lipop under scaffold split. MolBERT only matches RF in HIV.
- Concatenating RDKit2D descriptors to GROVER’s learned embeddings (GROVER_RDKit) significantly improves performance, suggesting the learned representations alone are insufficient and that fixed descriptors carry substantial predictive signal.
- For binding activity datasets (opioid receptors MOR, DOR, KOR), MorganBits fingerprints outperform other representations, consistent with the structural nature of binding.
- PhysChem descriptors excel on datasets where properties correlate strongly with simple molecular features (e.g., ESOL has a near-linear relationship between MolLogP and solubility), but perform poorly on binding activity datasets where the relationship is more complex.
Experimental Setup: 62,820 Models Across Diverse Datasets
Models evaluated
The study evaluates nine models across three categories:
- Traditional ML: Random Forest (RF), Support Vector Machine (SVM), XGBoost
- Regular neural networks: RNN (GRU variant), GCN, GIN
- Pretrained models: MolBERT (SMILES-based, ~85M parameters, pretrained on 1.6M molecules), GROVER (graph-based, ~48M parameters, pretrained on ~10M molecules), and GROVER_RDKit (GROVER with concatenated RDKit2D descriptors)
Molecular representations
Six fixed representations are evaluated: RDKit2D descriptors (200 features), PhysChem descriptors (11 features), MACCS keys, MorganBits fingerprints, MorganCounts fingerprints, and AtomPairs fingerprints. Morgan fingerprints use radius 2 and 2048 bits after testing showed little difference between common parameter choices.
Datasets
| Category | Datasets | Task Type | Source |
|---|---|---|---|
| MoleculeNet benchmarks | BACE, BBBP, HIV | Classification | MoleculeNet |
| MoleculeNet benchmarks | ESOL, FreeSolv, Lipop | Regression | MoleculeNet |
| Opioids-related | MDR1, CYP2D6, CYP3A4, MOR, DOR, KOR | Classification + Regression | ChEMBL |
| Activity datasets | 24 targets | Regression | Cortes-Ciriano et al. |
| Activity datasets | 30 targets (MoleculeACE) | Regression | Tilborg et al. |
| Descriptor datasets | MolWt, NumAtoms (16 sizes each) | Regression | ZINC250k |
Evaluation protocol
- Both scaffold and random splits (80:10:10 ratio)
- 30 different random seeds per experiment for statistical rigor
- Mann-Whitney U test for pairwise significance ($p < 0.05$, two-sided)
- Multiple metrics per task: AUROC, AUPRC, PPV, NPV for classification; RMSE, MAE, $R^2$, Pearson $R$ for regression
Key metrics
Classification:
$$ \text{PPV} = \frac{\text{TP}}{\text{TP} + \text{FP}} $$
$$ \text{NPV} = \frac{\text{TN}}{\text{TN} + \text{FN}} $$
Regression:
$$ \text{RMSE} = \sqrt{\frac{1}{N} \sum_{i=1}^{N} (y_i - \hat{y}_i)^2} $$
$$ \text{MAE} = \frac{1}{N} \sum_{i=1}^{N} |y_i - \hat{y}_i| $$
$$ \text{Pearson}_R = \frac{\sum_{i=1}^{N} (y_i - \bar{y}_{obs})(\hat{y}_i - \bar{y}_{pred})}{\sqrt{\sum_{i=1}^{N} (y_i - \bar{y}_{obs})^2 \sum_{i=1}^{N} (\hat{y}_i - \bar{y}_{pred})^2}} $$
$$ R^2 = 1 - \frac{\sum_{i=1}^{N} (y_i - \hat{y}_i)^2}{\sum_{i=1}^{N} (y_i - \bar{y}_{obs})^2} $$
Key Findings: Metrics, Activity Cliffs, and Dataset Size
Statistical testing is essential
Without statistical tests, there is a real risk of drawing incorrect conclusions. Analysis of individual splits shows that in certain splits, MolBERT or GROVER can appear to outperform RF, even though on aggregate with proper statistical testing, RF is significantly better. For example, in BBBP, RF dominates in 20 of 30 splits, but the remaining 10 could mislead a researcher using only a single split.
Metric choice changes conclusions
Different evaluation metrics can lead to contradictory conclusions about the same models:
- In BBBP under scaffold split, RF significantly outperforms other models by AUROC, but shows similar performance when evaluated by PPV or NPV.
- In FreeSolv, GROVER outperforms RF by Pearson $R$ ($p < 0.05$) but shows similar performance by $R^2$.
- Pearson $R$ can overestimate $R^2$: even when $R^2$ drops to zero or negative, Pearson $R$ can remain around 0.5.
- AUROC can be over-optimistic, especially on imbalanced datasets like CYP2D6 and CYP3A4.
The authors argue that PPV and NPV are more practically relevant for virtual screening than AUROC or AUPRC, since the goal is to identify true hits among predicted positives (or true non-binders among predicted negatives).
Activity cliffs pose a major challenge
Activity cliffs, defined as IC50 values spanning at least two orders of magnitude within one scaffold, are prevalent in the opioid-related datasets. Although AC scaffolds represent only about 10% of scaffolds, they encompass 25-46% of all molecules:
| Dataset | AC scaffolds (%) | AC molecules (%) |
|---|---|---|
| MDR1 | 62 (10.2%) | 594 (41.3%) |
| CYP2D6 | 124 (9.3%) | 710 (31.0%) |
| CYP3A4 | 146 (7.2%) | 926 (25.2%) |
| MOR | 213 (13.1%) | 1627 (46.1%) |
| DOR | 178 (11.6%) | 1342 (41.6%) |
| KOR | 218 (13.1%) | 1502 (45.2%) |
Prediction performance is consistently worse for AC molecules, indicating limited intra-scaffold generalization. Removing edge-case molecules (those sharing scaffolds with pIC50 spanning 5 to 7) from test sets generally improves classification performance, confirming that activity cliffs are a key source of prediction error.
Dataset size is critical for representation learning
Experiments on descriptor datasets (predicting MolWt and NumAtoms) reveal clear patterns:
- With fewer than 1K data points, traditional ML on fixed representations outperforms all neural network models except pretrained GROVER, which shows competitive performance in the low-data regime.
- MolBERT shows severely limited performance (RMSE > 200 for MolWt) with fewer than 10K data points.
- RNN achieves the best performance when dataset size exceeds 10K, demonstrating the promise of representation learning in the “big-data” regime.
- SVM achieves near-perfect RMSE (close to zero) on datasets larger than 10K when paired with AtomPairs fingerprints.
- GROVER’s performance does not substantially improve with increasing dataset size, while MolBERT improves at 100K but is slow to benefit from more data.
Representation learning models show higher metric variability
Representation learning models, particularly GROVER, exhibit higher variability in performance metrics across splits. This variability correlates negatively with mean performance: models with higher variability tend to perform worse on average. The authors emphasize the importance of reporting metric variability alongside means.
Scaffold split versus random split
Prediction performance under scaffold split is consistently worse than under random split, confirming the inter-scaffold generalization challenge. Notably, random split alleviates the intra-scaffold generalization challenge because some AC scaffolds are seen during training.
Descriptors correlate with specific properties
PhysChem descriptors excel on datasets where molecular properties correlate with simple descriptors (e.g., MolLogP has near $-1$ correlation with ESOL labels). For binding activity datasets, correlation coefficients mostly fall within $[-0.5, 0.5]$, explaining why PhysChem descriptors show limited performance on those tasks, while structural fingerprints are more useful.
Limitations and Future Directions
The authors acknowledge several limitations:
- Uncertainty from model training (random initialization, mini-batch shuffling) was not fully addressed. Ensembling was not evaluated due to computational cost.
- Experimental uncertainty in labels (noise, measurement error in pIC50 values) was not modeled, though it can be heteroscedastic and impact performance.
- Model explainability was not covered, although it is important for building trust in AI tools for drug discovery.
- The study focused on GROVERbase only (not GROVERlarge) due to computational constraints.
Future directions include: exploring better ways to use fixed representations alongside learned ones, developing techniques for chemical space generalization (both inter- and intra-scaffold), incorporating experimental uncertainty into model training and evaluation, and generating larger high-quality datasets to fully harness representation learning models.
Reproducibility Details
Data
| Purpose | Dataset | Size | Notes |
|---|---|---|---|
| Benchmark | MoleculeNet (BACE, BBBP, HIV, ESOL, FreeSolv, Lipop) | 642-41,127 molecules | Downloaded from MolMapNet; max length < 400 |
| Activity | Opioids-related (MDR1, CYP2D6, CYP3A4, MOR, DOR, KOR) | Varies | Collected from ChEMBL27; pIC50 values |
| Activity | Cortes-Ciriano et al. 24 targets | Varies | Activity data for drug targets |
| Activity | MoleculeACE 30 targets | Varies | Activity cliffs emphasis |
| Descriptor | MolWt, NumAtoms from ZINC250k | 0.1K to 100K | 16 dataset sizes per descriptor |
Algorithms
- RF: 500 trees (following Chemprop)
- SVM: linear kernel
- XGBoost: gradient boosting regressor/classifier with default hyperparameters
- RNN: GRU variant, hidden size 512, 3 fully connected layers
- GCN/GIN: embedding dimension 300, 5 convolutional layers, hidden size 512
- MolBERT: BERTBase architecture, 768 embedding, 12 layers, 12 heads, ~85M parameters (769 fine-tuned)
- GROVER: GROVERbase, ~48M parameters (~5.2M fine-tuned)
- All splits repeated 30 times with seeds 0-29
Models
All model configurations, splits, and raw predictions are available in the GitHub repository.
Evaluation
Metrics: AUROC, AUPRC, PPV, NPV (classification); RMSE, MAE, $R^2$, Pearson $R$ (regression). Statistical testing via Mann-Whitney U test ($p < 0.05$, two-sided). Youden’s $J$ statistic used to determine classification threshold for PPV/NPV.
Hardware
All neural network experiments run on a single NVIDIA V100 GPU for 100 epochs. Batch size 32 for most experiments; 256 for GROVER on HIV due to compute time (MolBERT takes ~3 hours per split on HIV at batch size 32; GROVER takes ~5 hours at batch size 256). The study is partially funded by Stony Brook University OVPR Seed Grant, using the AI Institute at Stony Brook for computational resources.
| Artifact | Type | License | Notes |
|---|---|---|---|
| Respite_MPP | Code | Unknown | Code, data, and raw predictions |
| Nature Communications article | Paper | CC-BY-4.0 | Open access |
Paper Information
Citation: Deng, J., Yang, Z., Wang, H., Ojima, I., Samaras, D., & Wang, F. (2023). A systematic study of key elements underlying molecular property prediction. Nature Communications, 14, 6395. https://doi.org/10.1038/s41467-023-41948-6
Publication: Nature Communications 2023
Additional Resources:
Citation
@article{deng2023systematic,
  title={A systematic study of key elements underlying molecular property prediction},
  author={Deng, Jianyuan and Yang, Zhibo and Wang, Hehe and Ojima, Iwao and Samaras, Dimitris and Wang, Fusheng},
  journal={Nature Communications},
  volume={14},
  number={1},
  pages={6395},
  year={2023},
  doi={10.1038/s41467-023-41948-6}
}