A Spectral Framework for Evaluating Molecular ML Generalizability
This is a Method paper that introduces SPECTRA (SPECtral framework for model evaluaTion on moleculaR dAtasets), a systematic approach for evaluating how well machine learning models generalize on molecular sequencing data. The primary contribution is a framework that generates train-test splits with controlled, decreasing levels of overlap, producing a spectral performance curve (SPC) and a single summary metric, the area under the spectral performance curve (AUSPC), for comparing model generalizability across tasks and architectures.
Why Existing Molecular Benchmarks Overestimate Generalizability
Deep learning has achieved high performance on molecular sequencing benchmarks, but a persistent gap exists between benchmark performance and real-world deployment. The authors identify the root cause: existing evaluation approaches use either metadata-based (MB) splits or similarity-based (SB) splits, both of which provide an incomplete picture of generalizability.
MB splits partition data by metadata properties (e.g., temporal splits, random splits) without controlling sequence similarity between train and test sets. This means high train-test similarity can inflate performance metrics. SB splits control similarity at a single threshold, but the model’s behavior at other similarity levels remains unknown.
For example, the TAPE benchmark’s remote homology family split has 97% cross-split overlap, while the superfamily split has 71%. Model accuracy drops by 50% between these two points, yet the full curve of performance degradation is never characterized. This gap between evaluated and real-world overlap levels leads to overoptimistic deployment expectations, as demonstrated by the case of rifampicin resistance prediction in M. tuberculosis, where commercial genotypic assays later proved unreliable in specific geographic regions.
The SPECTRA Framework: Spectral Properties, Graphs, and Performance Curves
SPECTRA takes three inputs: a molecular sequencing dataset, a machine learning model, and a spectral property definition. A spectral property (SP) is a molecular sequence property expected to influence model generalizability for a specific task. For sequence-to-sequence datasets, the spectral property is typically sequence identity (proportion of aligned positions > 0.3). For mutational scan datasets, it is defined by sample barcodes (string representations of mutations present in each sample).
Spectral Property Graph Construction
SPECTRA constructs a spectral property graph (SPG) where nodes represent samples and edges connect samples that share the spectral property. The goal is to generate train-test splits with controlled levels of cross-split overlap by finding approximate maximal independent sets of this graph.
Finding the exact maximal independent set is NP-Hard, so SPECTRA uses a greedy randomized algorithm parameterized by a spectral parameter $\mathbf{SP} \in [0, 1]$:
- Randomly order SPG vertices
- Select the first vertex and delete each neighbor with probability equal to $\mathbf{SP}$
- Continue until no vertices remain
When $\mathbf{SP} = 0$, this produces a random split (maximum cross-split overlap). When $\mathbf{SP} = 1$, it approximates the maximal independent set (minimum cross-split overlap). For each spectral parameter value (incremented by 0.05 from 0 to 1), three splits with different random seeds are generated.
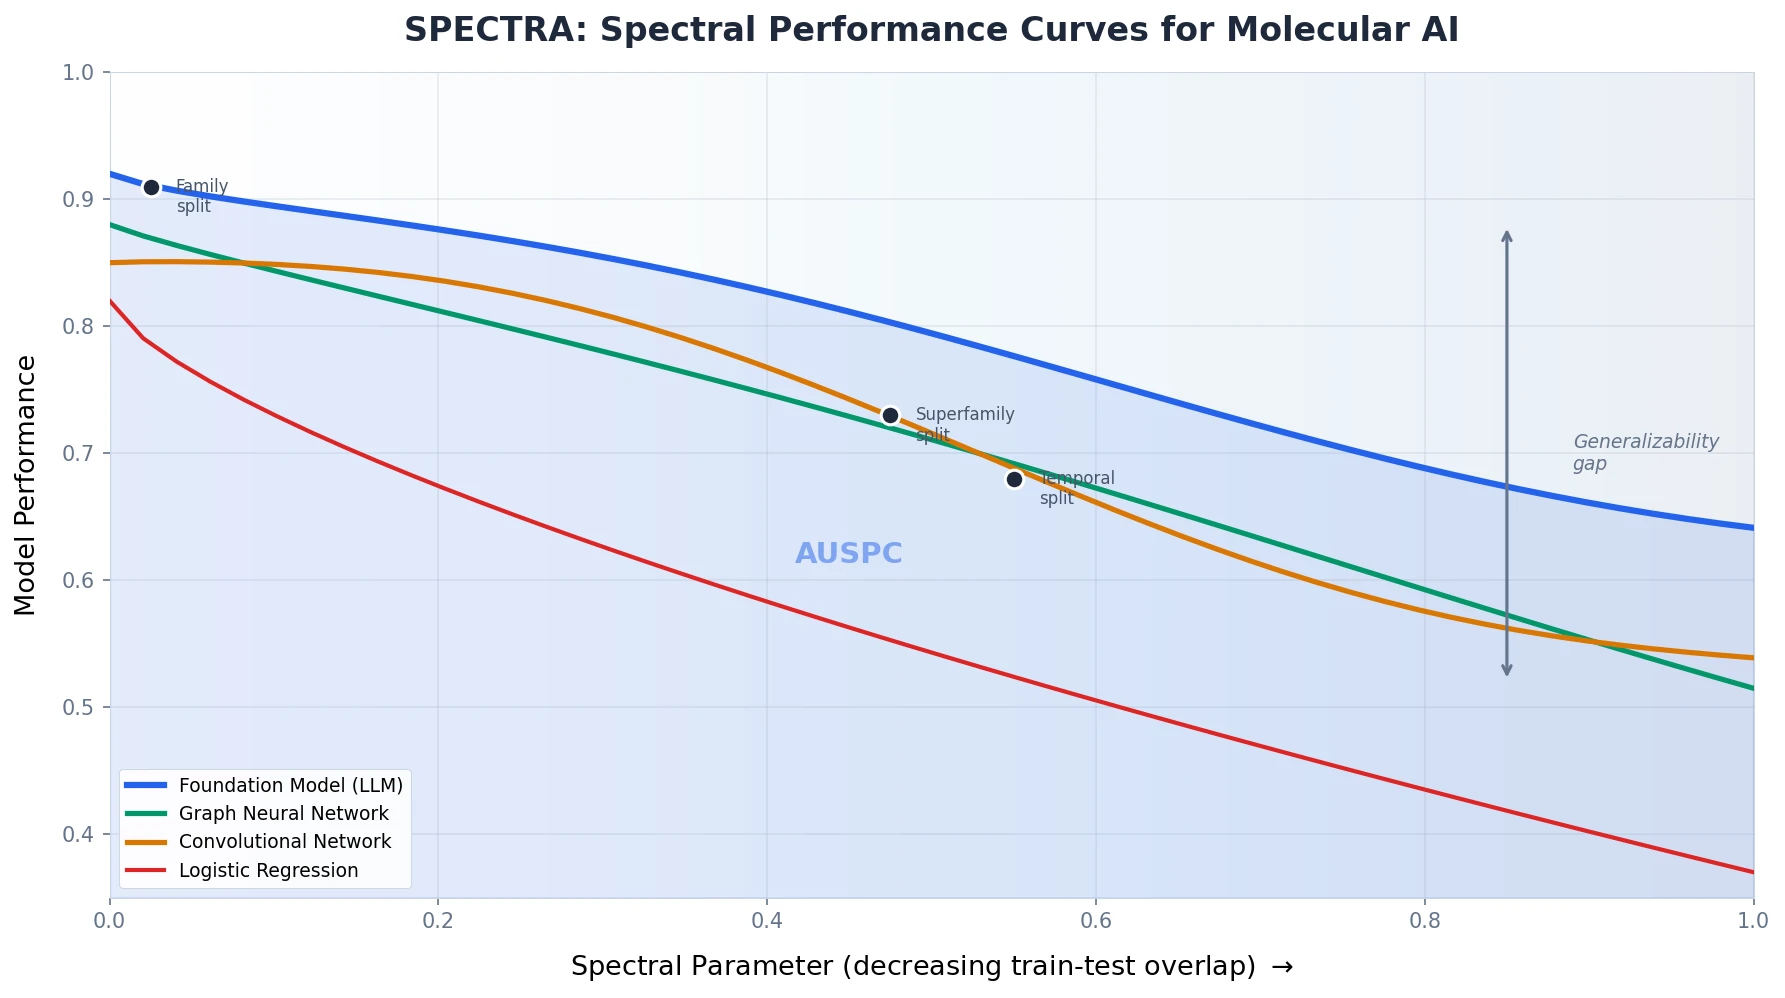
The Spectral Performance Curve and AUSPC
The model is trained and evaluated on each split. Plotting test performance against the spectral parameter produces the spectral performance curve (SPC). The area under this curve, the AUSPC, serves as a single summary metric for model generalizability that captures behavior across the full spectrum of train-test overlap.
Handling Mutational Scan Datasets
For mutational scan datasets where sample barcodes map to multiple samples, SPECTRA introduces two modifications: (1) weighting nodes in the SPG by the number of samples they represent, and (2) running a subset sum algorithm to ensure 80/20 train-test splits by sample count.
Evaluation Across 18 Datasets and 19 Models
The authors apply SPECTRA to 18 molecular sequencing datasets spanning three benchmarks (TAPE, PEER, ProteinGym) plus PDBBind, evaluating 19 models including CNNs, LSTMs, GNNs (GearNet), LLMs (ESM2), diffusion models (DiffDock), variational autoencoders (EVE), and logistic regression.
Benchmark Datasets
The core evaluation covers five primary tasks:
| Task | Dataset | Type | Metric | Samples |
|---|---|---|---|---|
| Rifampicin resistance (RIF) | TB clinical isolates | MSD | AUROC | 17,474 |
| Isoniazid resistance (INH) | TB clinical isolates | MSD | AUROC | 26,574 |
| Pyrazinamide resistance (PZA) | TB clinical isolates | MSD | AUROC | 12,146 |
| Fluorescence prediction | GFP variants | MSD | Spearman’s $\rho$ | 54,024 |
| Vaccine escape | SARS-CoV-2 RBD | MSD | Spearman’s $\rho$ | 438,046 |
Additional benchmarks include remote homology detection, secondary structure prediction, subcellular localization, and protein-ligand binding (PDBBind, Astex diverse set, Posebusters).
Models Evaluated
Eight models were evaluated in depth across the five primary tasks: logistic regression, CNN, ESM2 (pretrained), ESM2-Finetuned, GearNet, GearNet-Finetuned, EVE, and SeqDesign. Additional models (LSTM, ResNet, DeepSF, Transformer, HHblits, Equibind, DiffDock, TankBind, Transception, MSA Transformer, ESM1v, Progen2) were evaluated on specific benchmark tasks.
Existing Splits as Points on the SPC
SPECTRA reveals that existing benchmark splits correspond to specific points on the spectral performance curve. For instance:
| Task | Benchmark Split | Cross-Split Overlap | Spectral Parameter |
|---|---|---|---|
| Remote homology | TAPE family | 97% | 0.025 |
| Remote homology | TAPE superfamily | 71% | 0.475 |
| Secondary structure | CASP12 | 48% | 0.5 |
| Protein-ligand binding | Equibind temporal | 76% | 0.55 |
| Protein-ligand binding | LPPDBind similarity | 91% | 0.275 |
| Protein-ligand binding | Posebusters | 70% | 0.575 |
Performance Degradation and Foundation Model Insights
Universal Performance Decline
All evaluated models demonstrate decreased performance as cross-split overlap decreases. Logistic regression drops from AUROC > 0.9 to 0.5 for rifampicin resistance. ESM2-Finetuned decreases from Spearman’s $\rho > 0.9$ to less than 0.4 for GFP fluorescence prediction.
No single model achieves the highest AUSPC across all tasks. CNN maintains AUSPC > 0.6 across all tasks but is surpassed by ESM2-Finetuned and ESM2 on rifampicin resistance. Some models retain reasonable performance even at $\mathbf{SP} = 1$ (minimal overlap): ESM2, ESM2-Finetuned, and CNN maintain AUROC > 0.7 for RIF and PZA at this extreme.
Uncovering Hidden Spectral Properties
SPECTRA can detect unconsidered spectral properties through high variance in model performance at fixed spectral parameters. For rifampicin resistance, the CNN shows high variance at $\mathbf{SP} = 0.9$, $0.95$, and $1.0$ (standard deviations of 0.09, 0.10, and 0.08 respectively).
The authors trace this to the rifampicin resistance determining region (RRDR), a 26-amino-acid region of the rpoB gene. They define diff-RRDR as:
$$ \text{diff-RRDR} = \left(\max\left(\text{position}_{\text{train}}\right) - \max\left(\text{position}_{\text{test}}\right)\right) + \left(\min\left(\text{position}_{\text{train}}\right) - \min\left(\text{position}_{\text{test}}\right)\right) $$
diff-RRDR correlates with CNN performance variance (Spearman’s $\rho = -0.51$, p-value $= 1.79 \times 10^{-5}$) but not with ESM2 performance. The authors attribute this to ESM2’s larger context window (512 positions vs. CNN’s 12), making it more invariant to positional shifts in resistance-determining mutations.
Foundation Model Generalizability
For protein foundation models, SPECTRA reveals that AUSPC correlates with the similarity between task-specific datasets and the pretraining dataset. ESM2’s AUSPC varies from 0.91 (RIF) to 0.26 (SARS-CoV-2). The correlation between UniRef50 overlap and AUSPC is strong (Spearman’s $\rho = 0.9$, p-value $= 1.4 \times 10^{-27}$).
This finding holds across multiple foundation models (Transception, MSA Transformer, ESM1v, Progen2) evaluated on five ProteinGym datasets (Spearman’s $\rho = 0.9$, p-value $= 0.04$). Fine-tuning improves AUSPC for tasks with low pretraining overlap (PZA, SARS-CoV-2, GFP).
Computational Cost
Generating SPECTRA splits ranges from 5 minutes (amyloid beta aggregation) to 9 hours (PDBBind). Generating spectral performance curves ranges from 1 hour (logistic regression) to 5 days (ESM2-Finetuned). The authors recommend releasing SPECTRA splits alongside new benchmarks to amortize this cost.
Limitations and Future Directions
The authors acknowledge several limitations:
- Spectral property selection is pivotal: The choice of spectral property must be biologically informed and task-specific. Standardized definitions across the community are needed.
- Computational cost: Running SPECTRA is expensive, especially for large models. The authors mitigate this with multi-core CPU parallelization and multi-GPU training.
- Not a model ranking tool: SPECTRA is designed for understanding generalizability patterns, not for ranking models. Proper ranking requires averaging AUSPCs across many tasks in a standardized benchmark.
- Spectral parameter vs. cross-split overlap: The minimal achievable cross-split overlap varies across tasks, so SPECTRA plots performance against the spectral parameter rather than overlap directly. This means the AUSPC reflects relative impact on performance per unit decrease in overlap.
The authors envision SPECTRA as a foundation for next-generation molecular benchmarks that explicitly characterize generalizability across the full spectrum of distribution shift, applicable beyond molecular data to small molecule therapeutics, inverse protein folding, and patient-level clinical datasets.
Reproducibility Details
Data
All data used in this study is publicly available.
| Purpose | Dataset | Size | Notes |
|---|---|---|---|
| Evaluation | TB RIF resistance | 17,474 isolates | From Green et al. (2022) |
| Evaluation | TB INH resistance | 26,574 isolates | From Green et al. (2022) |
| Evaluation | TB PZA resistance | 12,146 isolates | From Green et al. (2022) |
| Evaluation | GFP fluorescence | 54,024 samples | From Sarkisyan et al. (2016) |
| Evaluation | SARS-CoV-2 escape | 438,046 samples | From Greaney et al. (2021) |
| Benchmark | TAPE (remote homology, secondary structure) | Various | From Rao et al. (2019) |
| Benchmark | PEER (subcellular localization) | 13,949 samples | From Xu et al. (2022) |
| Benchmark | ProteinGym (amyloid, RRM) | Various | From Notin et al. (2022) |
| Benchmark | PDBBind (protein-ligand binding) | 14,993-16,742 complexes | From Wang et al. (2005) |
Data is also available on Harvard Dataverse.
Algorithms
- Spectral property comparison uses Biopython pairwise alignment (match=1, mismatch=-2, gap=-2.5) with a 0.3 similarity threshold for sequence-to-sequence datasets
- Greedy randomized maximal independent set approximation for split generation
- Spectral parameter incremented in 0.05 steps from 0 to 1
- Three random seeds per spectral parameter value
- 80/20 train-test split ratio enforced via subset sum for mutational scan datasets
Models
- ESM2: 650M parameter version from Lin et al. (2023)
- ESM2-Finetuned: First 30 layers frozen, masked language head replaced with linear prediction layer
- GearNet and GearNet-Finetuned: Protein structures generated via ESMFold
- CNN: Architecture from Green et al. (2022), one-hot encoded sequences
- Logistic regression: One-hot encoded mutational barcodes
- EVE and SeqDesign: MSAs constructed via Jackhmmer against UniRep100
Evaluation
| Metric | Task | Notes |
|---|---|---|
| AUROC | TB resistance (RIF, INH, PZA) | Binary classification |
| Spearman’s $\rho$ | GFP fluorescence, SARS-CoV-2 escape | Regression tasks |
| Accuracy | Remote homology, secondary structure, subcellular localization | Per-label/class accuracy |
| RMSE | Protein-ligand binding | Predicted vs. actual complex |
| AUSPC | All tasks | Area under spectral performance curve |
Hardware
- Most models: 1x Tesla A10 GPU
- ESM2-Finetuned: 4x Tesla A100 GPUs on Azure cluster
- Hyperparameter optimization: Weights & Biases random search over learning rate
- All code in PyTorch
Artifacts
| Artifact | Type | License | Notes |
|---|---|---|---|
| SPECTRA Code | Code | MIT | Framework implementation and reproduction scripts |
| Harvard Dataverse | Dataset | CC0 1.0 | All datasets and generated splits |
Paper Information
Citation: Ektefaie, Y., Shen, A., Bykova, D., Marin, M. G., Zitnik, M., & Farhat, M. (2024). Evaluating generalizability of artificial intelligence models for molecular datasets. Nature Machine Intelligence, 6(12), 1512-1524. https://doi.org/10.1038/s42256-024-00931-6
@article{ektefaie2024evaluating,
  title={Evaluating generalizability of artificial intelligence models for molecular datasets},
  author={Ektefaie, Yasha and Shen, Andrew and Bykova, Daria and Marin, Maximillian G. and Zitnik, Marinka and Farhat, Maha},
  journal={Nature Machine Intelligence},
  volume={6},
  number={12},
  pages={1512--1524},
  year={2024},
  publisher={Nature Publishing Group},
  doi={10.1038/s42256-024-00931-6}
}