A Standardized Benchmark for Molecular Design
GuacaMol is a Resource paper. Its primary contribution is a standardized, open-source benchmarking framework for evaluating models for de novo molecular design. The framework defines 5 distribution-learning benchmarks and 20 goal-directed optimization benchmarks, implemented as a Python package. The authors also provide baseline results for several classical and neural generative models, establishing reference performance levels for future comparisons.
The Need for Consistent Evaluation in Generative Chemistry
By 2018, deep generative models for molecular design (VAEs, RNNs, GANs) had shown promising results, but the field lacked consistent evaluation standards. Different papers used different tasks, different datasets, and different metrics, making it difficult to compare models or assess real progress. Comparative studies between neural approaches and well-established algorithms like genetic algorithms were rare.
In other areas of machine learning, standardized benchmarks (ImageNet for vision, GLUE for NLP) had driven rapid progress by enabling fair comparisons. The de novo design community lacked an equivalent. Additionally, many existing evaluations focused on easily optimizable properties (logP, QED) that could not differentiate between models, since even simple baselines achieved near-perfect scores on those tasks.
Benchmark Design: Distribution Learning and Goal-Directed Optimization
GuacaMol separates evaluation into two independent dimensions, reflecting the two main use cases of generative models.
Distribution-Learning Benchmarks
These five benchmarks assess how well a model learns to generate molecules similar to a training set (a standardized subset of ChEMBL 24):
- Validity: Fraction of generated molecules that are chemically valid (parseable by RDKit), measured over 10,000 generated samples.
- Uniqueness: Fraction of unique canonical SMILES among 10,000 valid generated molecules.
- Novelty: Fraction of generated molecules not present in the training set, measured over 10,000 unique samples.
- Fréchet ChemNet Distance (FCD): Measures distributional similarity between generated and reference molecules using hidden representations from ChemNet (trained on biological activity prediction). The FCD score is transformed as:
$$S = \exp(-0.2 \cdot \text{FCD})$$
- KL Divergence: Compares distributions of nine physicochemical descriptors (BertzCT, MolLogP, MolWt, TPSA, NumHAcceptors, NumHDonors, NumRotatableBonds, NumAliphaticRings, NumAromaticRings) plus maximum nearest-neighbor ECFP4 similarity. The final score aggregates per-descriptor KL divergences:
$$S = \frac{1}{k} \sum_{i}^{k} \exp(-D_{\text{KL}, i})$$
where $k = 9$ is the number of descriptors.
Goal-Directed Benchmarks
The 20 goal-directed benchmarks evaluate a model’s ability to generate molecules that maximize a given scoring function. These span several categories:
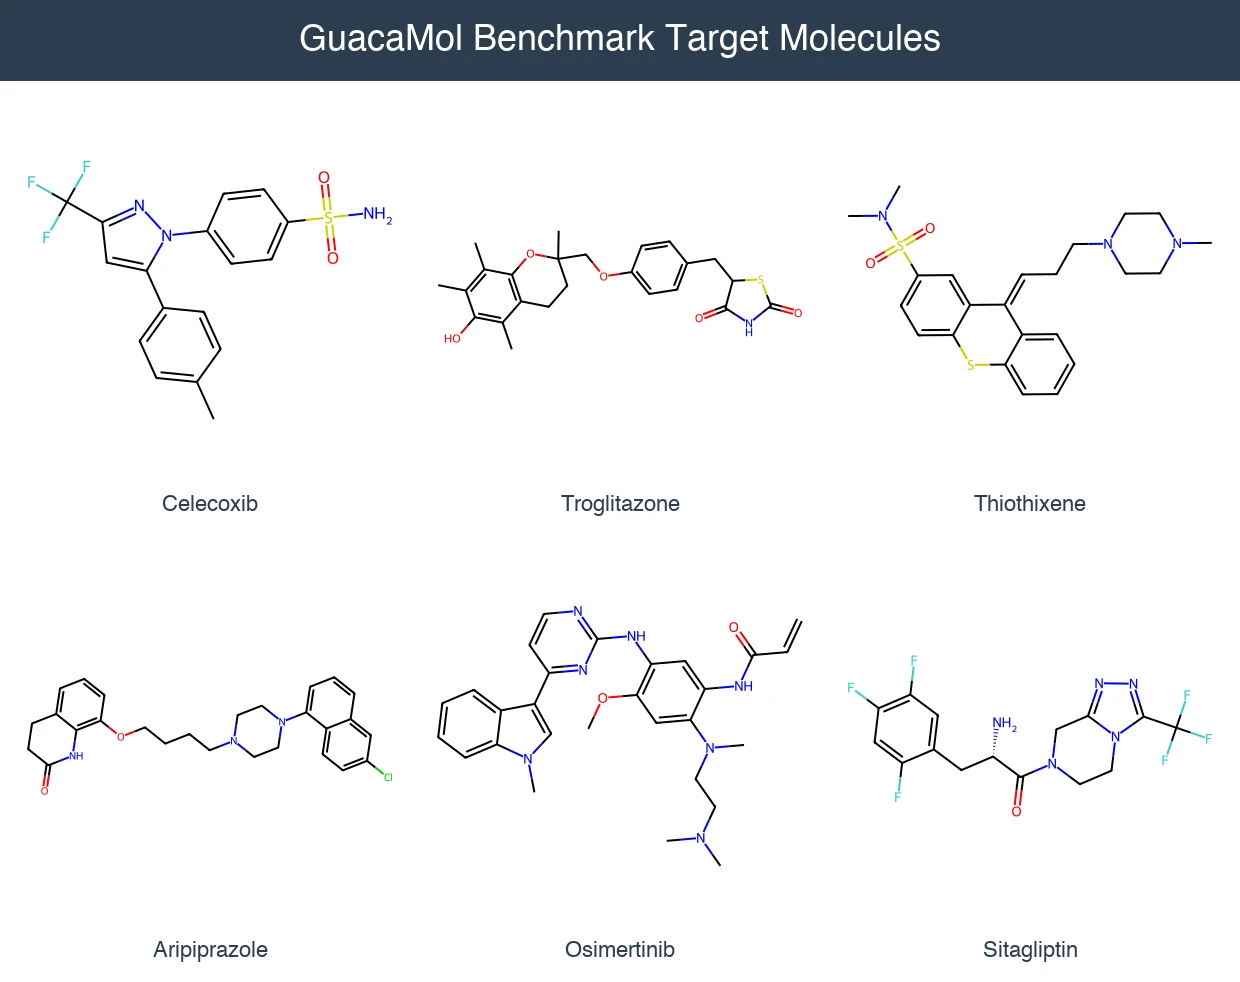
- Rediscovery (3 tasks): Regenerate a specific target molecule (Celecoxib, Troglitazone, Thiothixene) using Tanimoto similarity on ECFP4 fingerprints.
- Similarity (3 tasks): Generate many molecules similar to a target (Aripiprazole, Albuterol, Mestranol) above a threshold of 0.75.
- Isomers (2 tasks): Generate molecules matching a target molecular formula ($\text{C}_{11}\text{H}_{24}$ and $\text{C}_9\text{H}_{10}\text{N}_2\text{O}_2\text{PF}_2\text{Cl}$).
- Median molecules (2 tasks): Maximize similarity to two reference molecules simultaneously (camphor/menthol and tadalafil/sildenafil).
- Multi-property optimization (7 tasks): Optimize combinations of similarity, physicochemical properties, and structural features for drug-relevant molecules (Osimertinib, Fexofenadine, Ranolazine, Perindopril, Amlodipine, Sitagliptin, Zaleplon).
- SMARTS-based (1 task): Target molecules containing specific substructure patterns with constrained physicochemical properties (Valsartan SMARTS).
- Scaffold/decorator hop (2 tasks): Modify molecular scaffolds while preserving substituent patterns, or vice versa.
The benchmark score for most goal-directed tasks combines top-1, top-10, and top-100 molecule scores:
$$S = \frac{1}{3}\left(s_1 + \frac{1}{10}\sum_{i=1}^{10} s_i + \frac{1}{100}\sum_{i=1}^{100} s_i\right)$$
where $s_i$ are molecule scores sorted in decreasing order.
Score Modifiers
Raw molecular properties are transformed via modifier functions to restrict scores to [0, 1]:
- Gaussian($\mu$, $\sigma$): Targets a specific property value
- MinGaussian($\mu$, $\sigma$): Full score below $\mu$, decreasing above
- MaxGaussian($\mu$, $\sigma$): Full score above $\mu$, decreasing below
- Thresholded($t$): Full score above threshold $t$, linear decrease below
Multi-property objectives use either arithmetic or geometric means to combine individual scores.
Baseline Models and Experimental Setup
The authors evaluate six baseline models spanning different paradigms:
Distribution-learning baselines:
- Random sampler: Samples molecules directly from the dataset (provides upper/lower bounds).
- SMILES LSTM: 3-layer LSTM (hidden size 1024) trained to predict next SMILES characters.
- Graph MCTS: Monte Carlo Tree Search building molecules atom-by-atom.
- VAE: Variational autoencoder on SMILES representations.
- AAE: Adversarial autoencoder.
- ORGAN: Objective-reinforced generative adversarial network.
Goal-directed baselines:
- Best of dataset: Scores all training molecules and returns the best (virtual screening baseline).
- SMILES LSTM: Same model with 20 iterations of hill-climbing (8192 samples per iteration, top 1024 for fine-tuning).
- SMILES GA: Genetic algorithm operating on SMILES strings with grammar-based mutations.
- Graph GA: Genetic algorithm operating on molecular graphs with crossover and mutation.
- Graph MCTS: Monte Carlo Tree Search with 40 simulations per molecule.
The training dataset is ChEMBL 24 after filtering: salt removal, charge neutralization, SMILES length cap of 100, element restrictions, and removal of molecules similar (ECFP4 > 0.323) to 10 held-out drug molecules used in benchmarks.
Distribution-Learning Results
| Benchmark | Random | SMILES LSTM | Graph MCTS | AAE | ORGAN | VAE |
|---|---|---|---|---|---|---|
| Validity | 1.000 | 0.959 | 1.000 | 0.822 | 0.379 | 0.870 |
| Uniqueness | 0.997 | 1.000 | 1.000 | 1.000 | 0.841 | 0.999 |
| Novelty | 0.000 | 0.912 | 0.994 | 0.998 | 0.687 | 0.974 |
| KL divergence | 0.998 | 0.991 | 0.522 | 0.886 | 0.267 | 0.982 |
| FCD | 0.929 | 0.913 | 0.015 | 0.529 | 0.000 | 0.863 |
Goal-Directed Results (Selected)
| Benchmark | Best of Dataset | SMILES LSTM | SMILES GA | Graph GA | Graph MCTS |
|---|---|---|---|---|---|
| Celecoxib rediscovery | 0.505 | 1.000 | 0.732 | 1.000 | 0.355 |
| Osimertinib MPO | 0.839 | 0.907 | 0.886 | 0.953 | 0.784 |
| Sitagliptin MPO | 0.509 | 0.545 | 0.689 | 0.891 | 0.458 |
| Scaffold Hop | 0.738 | 0.998 | 0.885 | 1.000 | 0.478 |
| Total (20 tasks) | 12.144 | 17.340 | 14.396 | 17.983 | 9.009 |
Key Findings and Limitations
Main Findings
The Graph GA achieves the highest total score across goal-directed benchmarks (17.983), followed closely by the SMILES LSTM (17.340). This result is notable because genetic algorithms are well-established methods, and the LSTM-based neural approach nearly matches their optimization performance.
However, compound quality tells a different story. When examining the top 100 molecules per task through chemical quality filters (SureChEMBL, Glaxo, PAINS rules), 77% of LSTM-generated molecules pass, matching the Best of ChEMBL baseline. In contrast, Graph GA produces only 40% passing molecules, and Graph MCTS only 22%. This suggests that neural models benefit from pre-training on real molecular distributions, which encodes implicit knowledge about what constitutes a “reasonable” molecule.
ORGAN performs poorly across all distribution-learning tasks, with more than half its generated molecules being invalid. This is consistent with mode collapse, a known problem in GAN training.
Simpler generative models (LSTM, VAE) outperform more complex architectures (ORGAN, AAE) on distribution learning. Graph MCTS struggles with both distribution learning and goal-directed optimization, suggesting that single-molecule search trees are less effective than population-based approaches.
Limitations
The authors explicitly identify several issues:
- Compound quality is hard to quantify: The rule-based filters used are acknowledged as “high precision, low recall” surrogates. They catch some problematic molecules but cannot encode the full breadth of medicinal chemistry expertise.
- Some benchmarks are too easy: The trivially optimizable tasks (logP, QED, CNS MPO) cannot differentiate between models. All baselines achieve near-perfect scores on these.
- Sample efficiency and runtime are not benchmarked: The framework does not penalize models for requiring excessive scoring function calls.
- Synthesis accessibility is not addressed: Generated molecules may be valid but impractical to synthesize.
Future Directions
The authors call for harder benchmark tasks, better compound quality metrics, attention to sample efficiency and runtime constraints, and further development of graph-based neural generative models.
Reproducibility Details
Data
| Purpose | Dataset | Size | Notes |
|---|---|---|---|
| Training | ChEMBL 24 (post-processed) | ~1.6M molecules | Salt removal, neutralization, SMILES length cap, element restrictions |
| Evaluation | 10 held-out drug molecules | 10 | Removed from training set via ECFP4 similarity threshold |
| Quality filters | SureChEMBL, Glaxo, PAINS, in-house rules | N/A | Applied via rd_filters |
Algorithms
- SMILES LSTM: 3-layer LSTM, hidden size 1024; hill-climbing with 20 iterations, 8192 samples per iteration, top 1024 for fine-tuning
- Graph GA: Population of 100, mating pool of 200, crossover + mutation (probability 0.5), 1000 epochs max
- SMILES GA: Population of 300, offspring of 600, SMILES grammar-based mutations, 1000 epochs max
- Graph MCTS: 40 simulations per molecule, 25 children per step, rollout to 60 atoms, starting from CC
Models
All baseline implementations are released as open-source code. VAE, AAE, and ORGAN implementations are from the MOSES repository.
Evaluation
All distribution-learning benchmarks sample 10,000 molecules. Goal-directed benchmarks use combinations of top-1, top-10, and top-100 scores. Compound quality is assessed via the percentage of top-100 molecules passing chemical filters.
Hardware
Hardware requirements are not specified in the paper.
Artifacts
| Artifact | Type | License | Notes |
|---|---|---|---|
| GuacaMol | Code | MIT | Benchmarking framework and scoring functions |
| GuacaMol Baselines | Code | MIT | Baseline model implementations |
| ChEMBL dataset | Dataset | CC-BY-SA 3.0 | Post-processed ChEMBL 24 for benchmarks |
| FCD package | Code | LGPL-3.0 | Fréchet ChemNet Distance implementation |
Paper Information
Citation: Brown, N., Fiscato, M., Segler, M. H. S., & Vaucher, A. C. (2019). GuacaMol: Benchmarking Models for De Novo Molecular Design. Journal of Chemical Information and Modeling, 59(3), 1096-1108. https://doi.org/10.1021/acs.jcim.8b00839
Additional Resources:
@article{brown2019guacamol,
  title={GuacaMol: Benchmarking Models for de Novo Molecular Design},
  author={Brown, Nathan and Fiscato, Marco and Segler, Marwin H. S. and Vaucher, Alain C.},
  journal={Journal of Chemical Information and Modeling},
  volume={59},
  number={3},
  pages={1096--1108},
  year={2019},
  publisher={American Chemical Society},
  doi={10.1021/acs.jcim.8b00839}
}